. 2007 Aug 15;2(8):e749.
doi: 10.1371/journal.pone.0000749.

3-D ultrastructure of O. tauri: electron cryotomography of an entire eukaryotic cell

Affiliations

3-D ultrastructure of O. tauri: electron cryotomography of an entire eukaryotic cell

Gregory P Henderson et al. PLoS One. .

Abstract

The hallmark of eukaryotic cells is their segregation of key biological functions into discrete, membrane-bound organelles. Creating accurate models of their ultrastructural complexity has been difficult in part because of the limited resolution of light microscopy and the artifact-prone nature of conventional electron microscopy. Here we explored the potential of the emerging technology electron cryotomography to produce three-dimensional images of an entire eukaryotic cell in a near-native state. Ostreococcus tauri was chosen as the specimen because as a unicellular picoplankton with just one copy of each organelle, it is the smallest known eukaryote and was therefore likely to yield the highest resolution images. Whole cells were imaged at various stages of the cell cycle, yielding 3-D reconstructions of complete chloroplasts, mitochondria, endoplasmic reticula, Golgi bodies, peroxisomes, microtubules, and putative ribosome distributions in-situ. Surprisingly, the nucleus was seen to open long before mitosis, and while one microtubule (or two in some predivisional cells) was consistently present, no mitotic spindle was ever observed, prompting speculation that a single microtubule might be sufficient to segregate multiple chromosomes.


Conflict of interest statement

Competing Interests: The authors have declared that no competing interests exist.

Figures

Figure 1
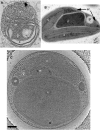
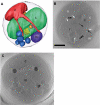
Figure 1. Preservation of O. tauri.
(A) Projection image through a conventionally fixed, embedded, thin-sectioned cell. (B) Projection image through a high-pressure frozen, low-temperature embedded, thin-sectioned cell. (C) 28.8-nm thick slice through the 3-D electron cryotomographic reconstruction of an intact, frozen-hydrated cell. The letters identify nuclei (n), chloroplasts (c), mitochondria (m), Golgi bodies (g), the Endoplasmic Reticulum (er), and granules (gr). Scale bar = 200 nm.
Figure 2
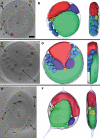
Figure 2. Cross-sections and 3-D segmentations of O. tauri cells.
Each row shows a single slice (A 21.6-nm; B 36-nm; C 9.6-nm) through the middle (left) and a manually segmented model (two perpendicular views, right) of one particular cell: (A, B) a non-dividing cell harvested at the dark-to-light transition; (C, D) a dividing cell harvested at the light-to-dark transition; (E, F) an unusual cell with a different internal organization and two membrane-bound cell extensions. Only the central portion of the cell in (F) is shown due to the limited ability to completely segment thicker cells. Here and below the letters and colors identify nuclei (n, red), nuclear envelope (ne), chloroplasts (c, green), mitochondria (m, dark purple), Golgi bodies (g, yellow), peroxisomes (p, orange), granules (gr, dark blue), inner membranes including ER (er, light blue), microtubules (light purple), and ribosome-like particles (r). Because the dividing cell shown in panels C and D was especially thick, only its middle region was segmentable. Scale bar 250 nm.
Figure 3
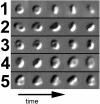
Figure 3. Light microscope images of free-floating O. tauri.
Sequential DIC images of five representative cells (1–5) tumbling freely in sea water culture medium after six hours growth in light are shown from left to right, demonstrating their disk-like shape.
Figure 4
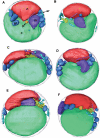
Figure 4. 3-D segmentations of six cells imaged at the dark-to-light transition (mid G1).
The cell in panel F is the same as in Figure 1A–B and 12. For scale, the diameter of the cell in panel D is approximately 1750 nm in diameter.
Figure 5
Figure 5. Cells with dividing organelles.
(A) Segmentation showing a portion of a NE streaming over the top of a chloroplast. Here the chloroplast is separated from the plasma membrane by the mitochondrion and several granules. (B) 36-nm thick slice near the top of the reconstruction of the same cell. The NE (white arrows) stretches towards the Golgi body (black arrowheads) and microtubule (black arrows). (C) 24-nm slice through a different cell, showing an elongated mitochondrion near the center of the cell and duplicating chloroplast granules. Scale bar = 150 nm.
Figure 6
Figure 6. Chloroplast.
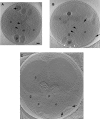
(A) 7.2-nm thick slice through a non-dividing cell. The starch granule (white arrow) has suffered damage from the electron beam. Besides it are two dark granules (white arrowhead). (B) Above: Enlarged view of the boxed area in panel A. The three thylakoid membranes (black arrowhead) can be seen forming a stack. Below: Schematic of above. Cell membrane (black), chloroplast membranes (green), outer thylakoid membrane (red), inner thylakoid membranes (blue). (C) 24-nm slice through an early predivisional cell, where the chloroplast is kidney-shaped rather than oval and the starch granule is elongated. (D) 36-nm thick slice through a late predivisional cell, where the chloroplast is deeply constricted and one dark and one starch granule is found in each side. Here the cytoplasmic granules (*) are arranged in a V-shape pointing to the division plane. Scale bar 250 nm.
Figure 7
Figure 7. Nuclear envelope.
(A) 41-nm thick slice through a cell harvested at the light-to-dark transition with a completely closed NE (black arrow). The cell’s small size and non-dividing organelles suggest the cell could have recently divided. Two NPCs (black arrowheads) are present. Close ups of the NPCs are shown at Figure 8. (B) 31-nm thick slice through a cell harvested at the dark-to-light transition. The NE only covers about three-fourths of the nucleus in this section (black arrows mark the tips). Again two NPCs (black arrowheads) are present, and at the bottom of the nucleus the ER branches off the NE (white arrowheads). (C) 19.2-nm thick slice through a large, late predivisional cell harvested at the light-to-dark transition exhibiting an almost completely open nucleus with only small patches of NE (black arrows). Scale bar 100 nm.
Figure 8
Figure 8. Nuclear pore complex.
3.6-nm thick slices through the best-resolved NPC from the “side” (perpendicular to the NE, left) and “top” (in plane of NE, right). The approximate center, inner, and outer diameters are marked by the arrow, dashed, and solid lines, respectively. The region around the NPC in the right panel is low density (whiter) because it is inside the NE lumen; the dark crescent near the edge of the panel shows where the plane of the slice cuts through the NE. Scale bar = 100 nm.
Figure 9
Figure 9. Mitochondrion.
(A) 3-D segmentation of the mitochondrion from the cell shown in Figure 1E–F. Here, the membranes are colored purple (outer membrane), red (inner membrane), and yellow (cristae). Dense granules within the mitochondrial matrix are shown in green. (B–D) 15-, 55-, and 29-nm thick slices though three different mitochondria, showing crista junctions (arrowheads) and a dense granule (white arrow). Panel B is a slice through the cell shown in panel A. Scale bar 50 nm (for panels B–D). (E) 4.8-nm thick slice through a junction or channel (black arrows) connecting the outer and inner membranes. Here c-cytoplasm, m-mitochondrion. Scale bar 50 nm.
Figure 10
Figure 10. Endoplasmic reticulum.
3-D segmentation of a cell harvested at the dark to light transition. ER (light blue) forms a sheet near the edge of the cell, perforated by four granules (dark blue).
Figure 11
Figure 11. Golgi body.
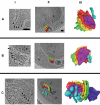
The Golgi bodies from three different cells are shown (rows A–C). In column I, slices through the reconstructions are shown, with cisternae marked by arrowheads. In column II, 3-D segmentations of the Golgi bodies are shown in situ within their cellular contexts. Column III shows the isolated 3-D segmentations from a view perpendicular to the one in column II. The five “core” cisternae common to all Golgi bodies seen here are colored purple, red, gold, yellow, and green (cis to trans). Surrounding vesicles are colored either light or dark blue. Some vesicles in column III do not appear in column II because they are “below” the cellular slice shown. The blue-green vesicle in IIC was removed from IIIC to create an unobstructed view of the Golgi body. Scale bars 100 nm.
Figure 12
Figure 12. Microtubule.
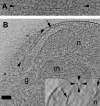
(A) 9.6-nm slice through one particular microtubule (arrowheads) along most of its length, showing its uniform diameter and hollow nature. (B) 16.8-nm slice through a microtubule in its cellular context, showing its open, blunt ends (arrowheads) terminating between the NE (arrows) and plasma membrane. The insert shows a 2-fold enlarged, 38.4-nm thick slice through the microtubule perpendicular to its long axis, emphasizing its tubular shape (arrowheads). Scale bar 100 nm.
Figure 13
Figure 13. Ribosome-like complexes.
(A) Three cells (shown in panels D–F of Figure 3) were searched for ribosome-like particles, and the resulting local-normalized cross-correlation coefficients are plotted from best to worst from left to right. There were fewer total positions ranked in cell “3D” because its cytoplasm was smaller. (B) 24-nm thick slice through a cell with the 500 (red) or 2000 (green) most ribosome-resembling objects in the cytoplasm circled, showing that these are reasonable under- and over-estimates of the total number. (C) 3-D positions of the 1250 most ribosome-resembling objects in the cytoplasm (light purple spheres), showing their close and even distribution. Scale bar 250 nm.
Figure 14
Figure 14. External macromolecular complexes.
(A) 12-nm thick slice showing multiple filaments (black arrowheads) emerging from a cellular protuberance. Black arrows point to ER. (B) 12-nm thick slice showing macromolecular complexes (white arrowheads) on the outer surface of the plasma membrane. Scale bar 100 nm.

References

    1. McDonald KL, Auer M. High-pressure freezing, cellular tomography, and structural cell biology. Biotechniques. 2006;41:137–143. - PubMed
    1. Lucic V, Forster F, Baumeister W. Structural studies by electron tomography: from cells to molecules. Annu Rev Biochem. 2005;74:833–865. - PubMed
    1. Hoog JL, Schwartz C, Noon AT, O'Toole ET, Mastronarde DN, et al. Organization of interphase microtubules in fission yeast analyzed by electron tomography. Dev Cell. 2007;12:349–361. - PubMed
    1. Dubochet J, Adrian M, Chang JJ, Homo JC, Lepault J, et al. Cryo-electron microscopy of vitrified specimens. Q Rev Biophys. 1988;21:129–228. - PubMed
    1. Grimm R, Barmann M, Hackl W, Typke D, Sackmann E, et al. Energy filtered electron tomography of ice-embedded actin and vesicles. Biophys J. 1997;72:482–489. - PMC - PubMed

Publication types

MeSH terms