. 2007 Apr-Jun;42(2):211-20.

Descriptive epidemiology of collegiate women's field hockey injuries: National Collegiate Athletic Association Injury Surveillance System, 1988-1989 through 2002-2003

Affiliations

Descriptive epidemiology of collegiate women's field hockey injuries: National Collegiate Athletic Association Injury Surveillance System, 1988-1989 through 2002-2003

Randall Dick et al. J Athl Train. 2007 Apr-Jun.

Abstract

Objective: To review 15 years of National Collegiate Athletic Association (NCAA) injury surveillance data for women's field hockey and identify potential areas for injury prevention initiatives.

Background: Field hockey is one of the most popular sports worldwide and is growing in participation in the United States, particularly among women. From 1988-1989 to 2002-2003, participation in NCAA women's field hockey increased 12%, with the largest growth among Division III programs. In 2002- 2003, 253 colleges offered women's field hockey and 5385 women participated.

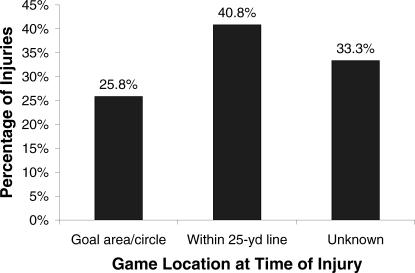
Main results: Game injury rates showed a significant average annual 2.5% decline over 15 years, most likely fueled by drops in ankle ligament sprain, knee internal derangement, and finger fracture injuries. Despite this, ankle ligament sprains were common (13.7% of game and 15.0% of practice injuries) and a frequent cause of severe injuries (resulting in 10+ days of time-loss activity). Concussion and head laceration injuries increased over this same time, and the risk of sustaining a concussion in a game was 6 times higher than the risk of sustaining one during practice. Overall, injury rates were twice as high in games as in practices (7.87 versus 3.70 injuries per 1000 athlete-exposures, rate ratio = 2.1, 95% confidence interval = 2.0, 2.3). Most head/neck/face (71%) and hand/finger/thumb (68%) injuries occurred when the player was near the goal or within the 25-yd line and were caused by contact with the stick or ball (greater than 77% for both body sites); for 34% of head/neck/ face injuries, a penalty was called on the play.

Recommendations: Equipment (requiring helmets and padded gloves) and rule changes (to decrease field congestion near the goal) as well as evidence-based injury prevention interventions (eg, prophylactic ankle taping/bracing, neuromuscular balance exercise programs) may be viable prevention initiatives for reducing injury rates in women's collegiate field hockey players.


Figures

Figure 1
Figure 1. Injury rates and 95% confidence intervals per 1000 athlete-exposures by games, practices, and academic year, women's field hockey, 1988–1989 through 2002–2003 (n = 1220 game injuries and 2066 practice injuries). Game time trend P < .01. Average annual change in game injury rate = −2.5% (95% confidence interval = −4.3, −0.6). Practice time trend P = .74. Average annual change in practice injury rate = 0.3% (95% confidence interval = −1.5, 2.1)
Figure 2
Figure 2. Game and practice injury mechanisms, all injuries, women's field hockey, 1988–1989 through 2002–2003 (n = 1220 game injuries and 2066 practice injuries). “Other contact” refers to contact with items such as balls, sticks, or the ground. Injury mechanism was unavailable for 2% of game injuries and 6% of practice injuries
Figure 3
Figure 3. Sport-specific game injury mechanisms, women's field hockey, 1996–1997 through 2002–2003 (n = 1220). Reliable information on game injury mechanism was collected starting in 1996– 1997
Figure 4
Figure 4. Game field location at time of injury, women's field hockey, 1996–1997 through 2002–2003 (n = 480). The goal area/circle is exclusive of the area within the 25-yd line on a regulation-size field. Reliable information on game field location was collected starting in 1996–1997
Figure 5
Figure 5. Game injuries by player position, weighted percentage, women's field hockey, 1996–1997 through 2002–2003 (weighted n = 182). Percentages are weighted based on the distribution of player positions on the field during typical play: goalie = 1, backfielders = 3, midfielders = 3, and forwards = 4. “Unknown” position was given a weight equal to 1. Reliable information on player position at time of game injury was collected starting in 1996–1997
Figure 6
Figure 6. A typical corner shot during field hockey play showing the field congestion confined to a small part of the field in front of the goal and within the 25-yd line (circle) and a player trapping the ball with her stick for a shot-on-goal attempt (arrow). Field congestion and the practice of trapping the ball have been speculatively associated with an increased risk of injuries, particularly to the head/face and hand/finger

References

    1. National Collegiate Athletic Association. 1981-82–2004-05 NCAA Sports Sponsorship and Participation Rates Report. Indianapolis, IN: National Collegiate Athletic Association; 2006.
    1. Dick R, Agel J, Marshall SW. National Collegiate Athletic Association Injury Surveillance System commentaries: introduction and methods. J Athl Train. 2007;42:173–182. - PMC - PubMed
    1. Murtaugh K. Injury patterns among female field hockey players. Med Sci Sports Exerc. 2001;33:201–207. - PubMed
    1. Powell JW, Barber-Foss KD. Injury patterns in selected high school sports: a review of the 1995–1997 seasons. J Athl Train. 1999;34:277–284. - PMC - PubMed
    1. Stevenson MR, Hamer P, Finch CF, Elliot B, Kresnow MJ. Sport, age, and sex specific incidence of injuries in Western Australia. Br J Sports Med. 2000;34:188–194. - PMC - PubMed

LinkOut - more resources