

Descriptive epidemiology of collegiate men's football injuries: National Collegiate Athletic Association Injury Surveillance System, 1988-1989 through 2003-2004
- PMID: 17710170
- PMCID: PMC1941296
Descriptive epidemiology of collegiate men's football injuries: National Collegiate Athletic Association Injury Surveillance System, 1988-1989 through 2003-2004
Abstract
Objective: To review 16 years of National Collegiate Athletic Association (NCAA) injury surveillance data for men's football and identify potential areas for injury prevention initiatives.
Background: Football is a high-velocity collision sport in which injuries are expected. Football tends to have one of the highest injury rates in sports. Epidemiologic data helps certified athletic trainers and other clinicians identify injury trends and patterns to appropriately design and institute injury prevention protocols and then measure their effects.
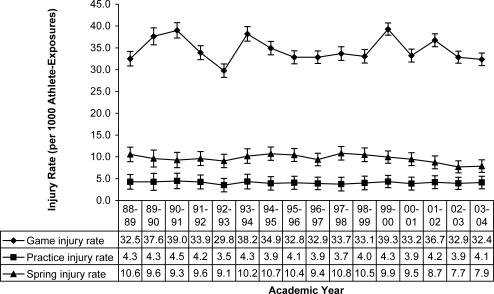
Main results: During the 16-year reporting period, about 19% of the Division I, II, and III NCAA institutions sponsoring football participated in the Injury Surveillance System. The results from the 16-year study period show little variation in the injury rates over time: games averaged 36 injuries per 1000 athlete-exposures (A-Es); fall practice, approximately 4 injuries per 1000 A-Es; and spring practice, about 10 injuries per 1000 A-Es. The game injury rate was more than 9 times higher than the in-season practice injury rate (35.90 versus 3.80 injuries per 1000 A-Es, rate ratio = 9.1, 95% confidence interval = 9.0, 9.2), and the spring practice injury rate was more than 2 times higher than the fall practice injury rate (9.62 versus 3.80 injuries per 1000 A-Es, rate ratio = 2.5, 95% confidence interval = 2.5, 2.6). The rate ratio for games versus fall practices was greatest for upper leg contusions (18.1 per 1000 A-Es), acromioclavicular joint sprains (14.0 per 1000 A-Es), knee internal derangements (13.4 per 1000 A-Es), ankle ligament sprains (12.0 per 1000 A-Es), and concussions (11.1 per 1000 A-Es).
Recommendations: Football is a complex sport that requires a range of skills performed by athletes with a wide variety of body shapes and types. Injury risks are greatest during games. Thus, injury prevention measures should focus on position-specific activities to reduce the injury rate. As equipment technology improves for the helmet, shoulder pads, and other protective devices, appropriate injury surveillance procedures should be performed to determine the effect of the new equipment on injury rates. A consistent evaluation of injury trends and patterns will assist decision makers in designing injury prevention techniques in areas that warrant the greatest attention and suggesting rule changes and modifications based on the data.
Figures
References
-
- 1981/82–2004/05 NCAA Sports Sponsorship and Participation Rates Report. Indianapolis, IN: National Collegiate Athletic Association; 2006.
-
- Powell JW. Pattern of knee injuries associated with college football 1975– 1982. Athl Train J NATA. 1985;20:104–109.
-
- Buckley WE, Powell J. NAIRS: an epidemiological overview of the severity of injury in college football 1975–1980 seasons. Athl Train J NATA. 1982;17:279–282.
MeSH terms
LinkOut - more resources
Full Text Sources
Medical
Research Materials