

Descriptive epidemiology of collegiate men's ice hockey injuries: National Collegiate Athletic Association Injury Surveillance System, 1988-1989 through 2003-2004
- PMID: 17710172
- PMCID: PMC1941284
Descriptive epidemiology of collegiate men's ice hockey injuries: National Collegiate Athletic Association Injury Surveillance System, 1988-1989 through 2003-2004
Abstract
Objective: To review 16 years of National Collegiate Athletic Association (NCAA) injury surveillance data for men's ice hockey and to identify potential areas for injury prevention initiatives.
Background: The NCAA began injury surveillance of men's ice hockey during the 1988-1989 academic year. These data represent all 3 NCAA divisions; the last Division II championship, however, was held during the 1998-1999 academic year.
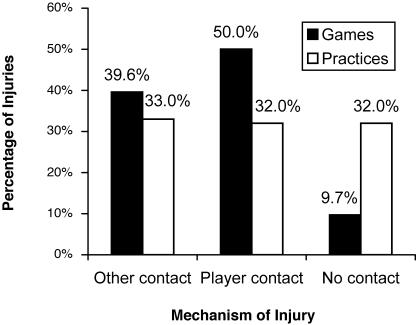
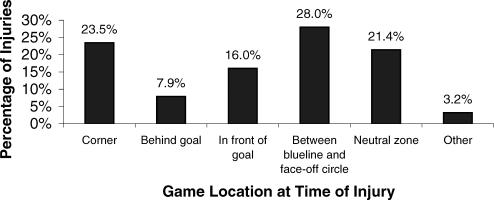
Main results: The rate of injury was more than 8 times higher in games than in practices (16.27 versus 1.96 injuries per 1000 athlete-exposures [A-Es], rate ratio = 8.3, 95% confidence interval [CI] = 7.9, 8.8). A significant average annual increase of 1.3% in game injury rates occurred over the sample period (P = .05), but practice rates stayed static (P = .77). Preseason practice injury rates were more than twice as high as regular-season practice rates (5.05 versus 1.94 injuries per 1000 A-Es, rate ratio = 2.6, 95% CI = 2.4, 2.9, P < .01). The majority of game and practice injuries occurred to the lower extremity. Knee internal derangement (13.5%) was the most common lower extremity injury reported for games, whereas pelvis and hip muscle strains (13.1%) were the most common injury reported during practices. Player-to-player contact was the most frequent game mechanism of injury (50.0%). The majority of injuries occurred between the blue line and face-off circles (28.0%), in the corner (23.5%), and in the neutral zone (21.4%).
Recommendations: Preventive efforts should focus on strategies that limit player-to-player contact in the neutral zone and at the top of the offensive and defensive zones. In addition, clinicians and researchers should identify risk factors and interventions for muscle strains at the pelvis and hip region.
Figures


References
-
- 1981/82–2004/05 NCAA Sports Sponsorship and Participation Rates Report. Indianapolis, IN: National Collegiate Athletic Association; 2006.
-
- Flik K, Lyman S, Marx RG. American collegiate men's ice hockey: an analysis of injuries. Am J Sports Med. 2005;33:183–187. - PubMed
-
- Pelletier RL, Montelpare WJ, Stark RM. Intercollegiate ice hockey injuries: a case for uniform definitions and reports. Am J Sports Med. 1993;21:78–81. - PubMed
-
- Hayes D. Hockey injuries: how, why, where, and when? Physician Sportsmed. 1975;3(1):61–65. - PubMed
MeSH terms
LinkOut - more resources
Full Text Sources
Medical