

Epidemiology of collegiate injuries for 15 sports: summary and recommendations for injury prevention initiatives
- PMID: 17710181
- PMCID: PMC1941297
Epidemiology of collegiate injuries for 15 sports: summary and recommendations for injury prevention initiatives
Abstract
Objective: To summarize 16 years of National Collegiate Athletic Association (NCAA) injury surveillance data for 15 sports and to identify potential modifiable risk factors to target for injury prevention initiatives.
Background: In 1982, the NCAA began collecting standardized injury and exposure data for collegiate sports through its Injury Surveillance System (ISS). This special issue reviews 182 000 injuries and slightly more than 1 million exposure records captured over a 16-year time period (1988-1989 through 2003-2004). Game and practice injuries that required medical attention and resulted in at least 1 day of time loss were included. An exposure was defined as 1 athlete participating in 1 practice or game and is expressed as an athlete-exposure (A-E).
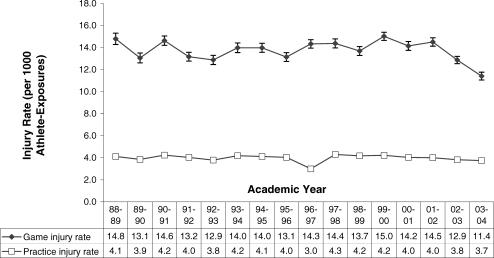
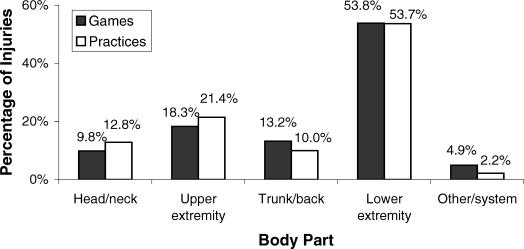
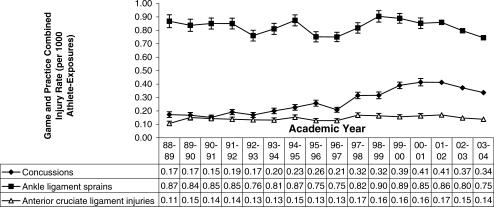
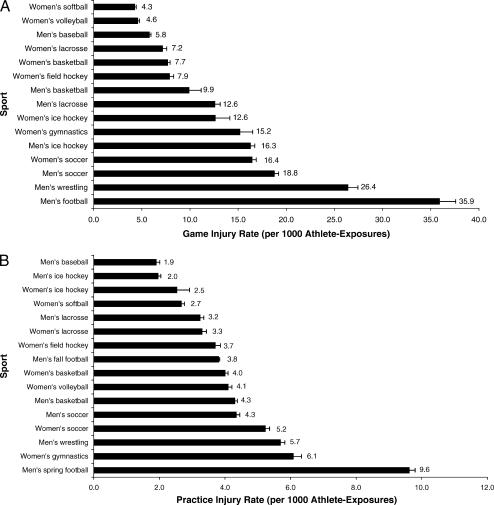
Main results: Combining data for all sports, injury rates were statistically significantly higher in games (13.8 injuries per 1000 A-Es) than in practices (4.0 injuries per 1000 A-Es), and preseason practice injury rates (6.6 injuries per 1000 A-Es) were significantly higher than both in-season (2.3 injuries per 1000 A-Es) and postseason (1.4 injuries per 1000 A-Es) practice rates. No significant change in game or practice injury rates was noted over the 16 years. More than 50% of all injuries were to the lower extremity. Ankle ligament sprains were the most common injury over all sports, accounting for 15% of all reported injuries. Rates of concussions and anterior cruciate ligament injuries increased significantly (average annual increases of 7.0% and 1.3%, respectively) over the sample period. These trends may reflect improvements in identification of these injuries, especially for concussion, over time. Football had the highest injury rates for both practices (9.6 injuries per 1000 A-Es) and games (35.9 injuries per 1000 A-Es), whereas men's baseball had the lowest rate in practice (1.9 injuries per 1000 A-Es) and women's softball had the lowest rate in games (4.3 injuries per 1000 A-Es).
Recommendations: In general, participation in college athletics is safe, but these data indicate modifiable factors that, if addressed through injury prevention initiatives, may contribute to lower injury rates in collegiate sports.
Figures
References
-
- National Athletic Trainers Association. Recommendations and guidelines for appropriate medical coverage of intercollegiate athletics, revised May 2003. Available at: http://www.nata.org/employers/ss/AMCIARecs%20andGuidesRevised.pdf. Accessed January 5, 2007 .
-
- National Collegiate Athletic Association. NCAA Football Division I Manual, Bylaws 17.11.2.4 and 17.11.2.5. Available at: http://www.ncaa.org/wps/portal/!ut/p/kcxml/04_Sj9SPykssy0xPLMnMz0vM0Y_Qj.... Accessed January 4, 2007 .
-
- Bergeron MF, McKeag DB, Casa DJ. Roundtable consensus statement: youth football: heat stress and injury risk. Med Sci Sports Exerc. 2005;37:1421–1430. et al. - PubMed
-
- Handoll HH, Rowe BH, Quinn KM, de Bie R. Interventions for preventing ankle ligament injuries. Cochrane Database Syst Rev. 2001;2:CD000018. - PubMed
Publication types
MeSH terms
LinkOut - more resources
Full Text Sources
Other Literature Sources
Medical