. 2007 Sep;117(9):2496-505.
doi: 10.1172/JCI29838.

Antihypertensive effects of selective prostaglandin E2 receptor subtype 1 targeting

Affiliations

Antihypertensive effects of selective prostaglandin E2 receptor subtype 1 targeting

Youfei Guan et al. J Clin Invest. 2007 Sep.

Abstract

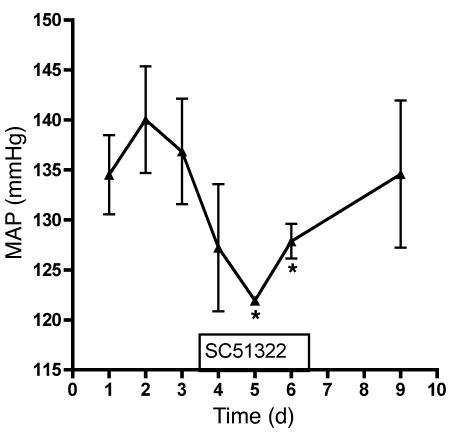
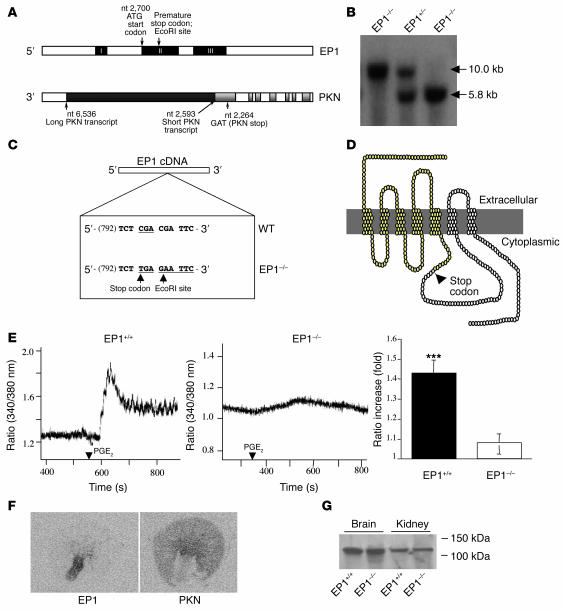
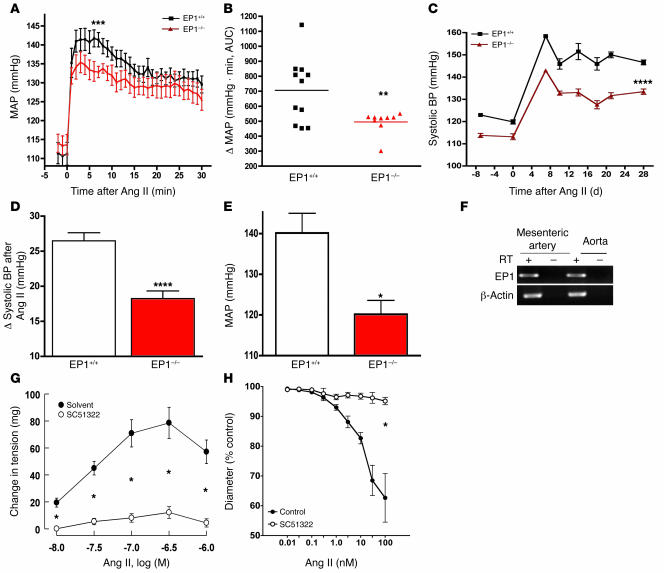
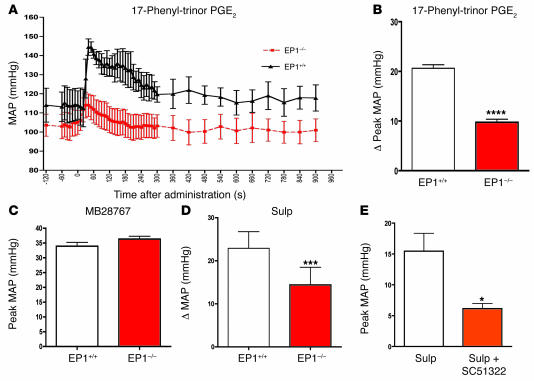
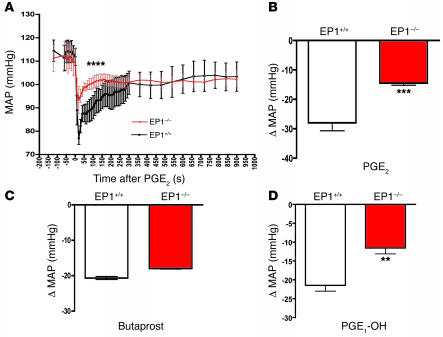
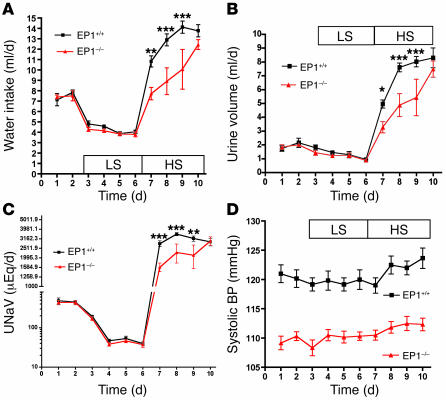
Clinical use of prostaglandin synthase-inhibiting NSAIDs is associated with the development of hypertension; however, the cardiovascular effects of antagonists for individual prostaglandin receptors remain uncharacterized. The present studies were aimed at elucidating the role of prostaglandin E2 (PGE2) E-prostanoid receptor subtype 1 (EP1) in regulating blood pressure. Oral administration of the EP1 receptor antagonist SC51322 reduced blood pressure in spontaneously hypertensive rats. To define whether this antihypertensive effect was caused by EP1 receptor inhibition, an EP1-null mouse was generated using a "hit-and-run" strategy that disrupted the gene encoding EP1 but spared expression of protein kinase N (PKN) encoded at the EP1 locus on the antiparallel DNA strand. Selective genetic disruption of the EP1 receptor blunted the acute pressor response to Ang II and reduced chronic Ang II-driven hypertension. SC51322 blunted the constricting effect of Ang II on in vitro-perfused preglomerular renal arterioles and mesenteric arteriolar rings. Similarly, the pressor response to EP1-selective agonists sulprostone and 17-phenyltrinor PGE2 were blunted by SC51322 and in EP1-null mice. These data support the possibility of targeting the EP1 receptor for antihypertensive therapy.


Figures

Figure 1
Figure 1. Effect of the EP1 receptor antagonist SC51322 (10 mg/kg/d by gavage) on MAP as determined by radiotelemetry in SHRs.
Values are mean ± SEM (n = 3). *P < 0.05 versus baseline, paired 2-tailed Student’s t test.
Figure 2
Figure 2. Generation and characterization of a hit-and-run–targeted EP1–/– mouse.
(A) Genomic organization of mouse EP1 and PKN genes. The EP1 gene consists of 3 exons (black boxes) spanning approximately 7.2 kb. Shown are the translational ATG start site (nucleotides 2,700–2,702) and the premature stop codon and EcoRI site introduced in the mutant. PKN is antiparallel with EP1, and 2 alternative 3′ splice variants (arrows) are characterized by differences in the 3′ UTR. (B) Southern blot of EcoRI digest demonstrated successful incorporation of the EcoRI site into the EP1–/– mouse. The radiolabeled EP1 probe recognized a 10-kb EcoRI fragment derived from the wild-type allele and a 5.8-kb fragment from the mutant allele. (C) Design of EP1+/+ and EP1–/– cDNA. The C795T mutation in knockout cDNA caused an in-frame R242X stop codon (CGA to TGA). Additionally, mutations C798G and G799A created a new EcoRI restriction site. (D) Secondary structure of EP1 receptor showing the site of truncation in the mutant receptor following the putative fifth membrane–spanning α-helix. (E) [Ca2+]i signaling in fura-2–loaded HEK293 cells transfected with EP1+/+ and EP1–/– cDNA was determined using the 340/380 nm emission intensity ratio. PGE2 (1 μM) significantly increased the ratio above basal values in cells transfected with EP1+/+ expression vector but not in HEK293 cells transfected with EP1–/–. (F) Autoradiogram in situ hybridization showed distribution of 35S-labled riboprobes for EP1 antisense and PKN (EP1 sense) probes demonstrating nonoverlapping and inverse distribution patterns in mouse kidney. (G) Immunoprecipitation of EP1+/+ and EP–/– mouse kidney and brain lysates showed PKN expression was not altered in EP1–/– mice.
Figure 3
Figure 3. Effect of EP1 gene disruption on in vivo effects of Ang II.
(A) Reduced pressor response to Ang II in EP1–/– versus EP1+/+ mice. MAP was recorded by intracarotid arterial monitoring before and during i.v. infusion of Ang II (75 pmol/kg/min). n = 8 per group. ***P < 0.005. (B) The pressor response to Ang II integrated over time was significantly reduced in EP1–/– compared with EP1+/+ mice. AUC, area under the curve. **P < 0.01. (C) Effect of chronic Ang II infusion (1,000 ng/kg/min) on systolic blood pressure determined by tail cuff. Baseline blood pressure was significantly lower in EP1–/– mice than in EP1+/+ mice (n = 5 per group) and the difference between genotypes increased following Ang II infusion. ***P < 0.001; ****P < 0.0001. (D) The change in systolic blood pressure following Ang II minipump was significantly greater in EP1+/+ than in EP1–/– mice (n = 5). ****P < 0.0001. (E) MAP determined by intracarotid catheterization was significantly greater in EP1+/+ (n = 3) than in EP1–/– (n = 4) mice infused with Ang II. *P < 0.05. (F) Expression of EP1 receptor mRNA in microdissected mouse mesenteric arteries and aortic tissue. Lack of RT was utilized as a negative control and β-actin served as RNA loading control. (G) Reduced constriction of Ang II on in vitro mesenteric arteriolar rings following pretreatment with the EP1 receptor antagonist SC51322. n = 7 per group. (H) Reduced Ang II constriction of preglomerular arterioles following treatment with EP1 receptor antagonist SC51322 (1 μM). n = 7 per group. *P < 0.005.
Figure 4
Figure 4. Effect of i. v. infusion of EP1/EP3 receptor agonists on MAP in EP1–/– and EP1+/+ mice.
(A) Temporal course showing reduced pressor effects of the mixed EP1/EP3 agonist 17-phenyltrinor PGE2 (20 μg/kg i.v. bolus) in EP1–/– (n = 5) versus EP1+/+ (n = 3) mice. P < 0.0001, repeated-measures 2-way ANOVA. (B) Increase in peak MAP (at about 40–70 s) following 17-phenyltrinor PGE2 (20 μg/kg i.v. bolus) was significantly less in EP1–/– than in EP1+/+ mice. ****P < 0.0001. (C) Identical peak pressor response to the pure EP3 agonist MB28767 in EP1–/– (n = 3) and EP1+/+ (n = 4) mice. (D) The peak pressor response to sulprostone (Sulp), another EP1/EP3 agonist, was reduced in EP1–/– mice. ***P < 0.001. (E) Pretreatment of mice with the EP1-selective agonist SC51322 (n = 5) significantly reduced the peak pressor response to sulprostone. *P < 0.05.
Figure 5
Figure 5. Effects of vasodepressor PGE2 analogs.
(A) Time course showing reduced vasodepressor response to PGE2 (100 μg/kg) in EP1–/– versus EP1+/+ mice. n = 8 per group. ****P < 0.0001, repeated-measures 2-way ANOVA. (B) EP1–/– mice exhibited a reduced vasodepressor response nadir following bolus PGE2 infusion. ***P < 0.005. (C) No difference was observed in MAP reduction following i.v. infusion of the EP2-selective agonist butaprost (20 μg/kg) in EP1–/– (n = 4) versus EP1+/+ (n = 3) mice. (D) EP1–/– mice exhibited a reduced vasodepressor response nadir in MAP following bolus infusion of the EP4-selective agonist PGE1-OH (100 μg/kg i.v.). **P < 0.01.
Figure 6
Figure 6. Effect of dietary sodium on water intake, urine volume, sodium excretion, and systolic blood pressure in 129S6/SvEvTac EP1–/– and EP1+/+ mice.
(A) Water intake in EP1–/– and EP1+/+ mice ingesting normal 0.25% (w/w) NaCl diet, followed by low-salt 0.02% NaCl diet (LS) and high-salt 8% NaCl diet (HS). **P < 0.01; ***P < 0.001. (B) Urine in EP1–/– and EP1+/+ mice on normal-, low-, and high-salt diet. *P < 0.05. ***P < 0.001, ANOVA. (C) Sodium excretion over a 24-hour period in EP1–/– and EP1+/+ mice. **P < 0.01; ***P < 0.001. UNaV, urine Na concentration multiplied by urine volume. (D) Systolic blood pressure was lower in EP1–/– mice than in EP1+/+ mice and was not affected by dietary sodium intake.

Similar articles

Cited by

References

    1. Kobayashi T., Narumiya S. Function of prostanoid receptors: studies on knockout mice. Prostaglandins Other Lipid Mediat. 2002;68–69:557–573. - PubMed
    1. Breyer M.D., Breyer R.M. Prostaglandin E receptors and the kidney. Am. J. Physiol. Renal Physiol. 2000;279:F12–F23. - PubMed
    1. Cheng H.F., Harris R.C. Cyclooxygenases, the kidney, and hypertension. Hypertension. 2004;43:525–530. doi: 10.1161/01.HYP.0000116221.27079.ea. - DOI - PubMed
    1. Izhar M., Alausa T., Folker A., Hung E., Bakris G.L. Effects of COX inhibition on blood pressure and kidney function in ACE inhibitor-treated blacks and hispanics. Hypertension. 2004;43:573–577. doi: 10.1161/01.HYP.0000115921.55353.e0. - DOI - PubMed
    1. Sowers J.R., et al. The Effects of cyclooxygenase-2 inhibitors and nonsteroidal anti-inflammatory therapy on 24-hour blood pressure in patients with hypertension, osteoarthritis, and type 2 diabetes mellitus. Arch. Intern. Med. 2005;165:161–168. doi: 10.1001/archinte.165.2.161. - DOI - PubMed

Publication types

MeSH terms