. 2007 Sep;117(9):2570-82.
doi: 10.1172/JCI31911.

Plasmacytoid dendritic cells from mouse tumor-draining lymph nodes directly activate mature Tregs via indoleamine 2,3-dioxygenase

Affiliations

Plasmacytoid dendritic cells from mouse tumor-draining lymph nodes directly activate mature Tregs via indoleamine 2,3-dioxygenase

Madhav D Sharma et al. J Clin Invest. 2007 Sep.

Abstract

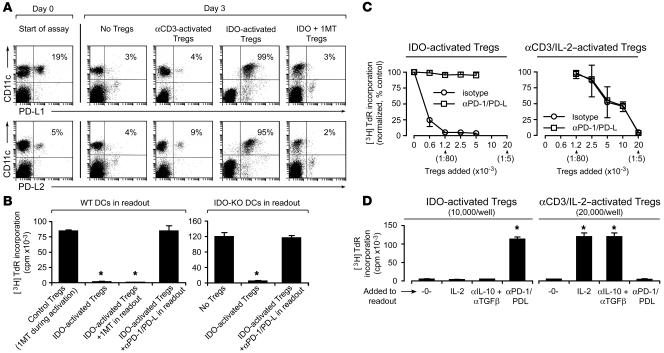
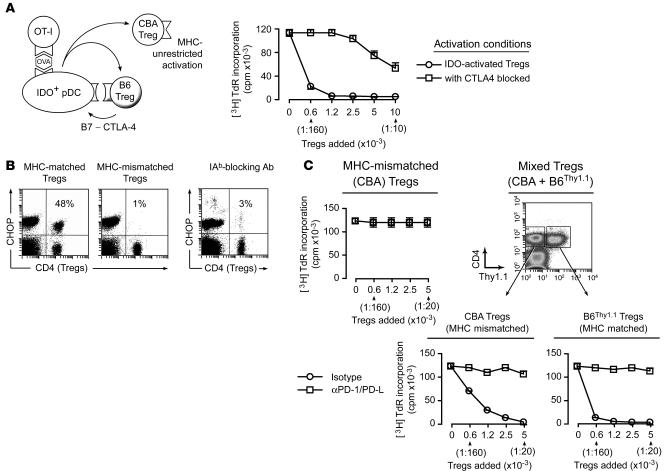
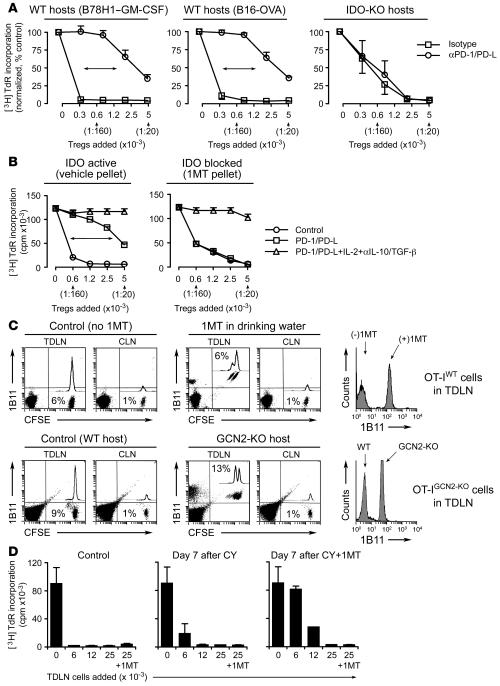
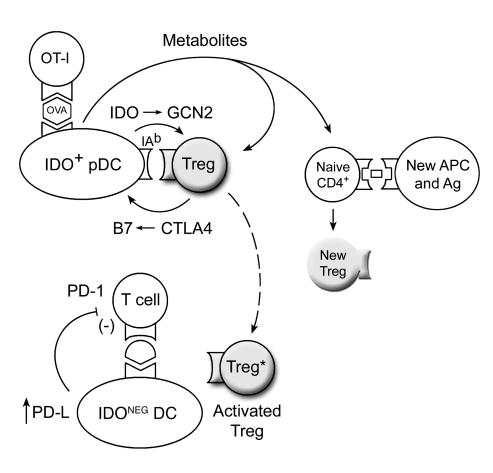
A small population of plasmacytoid DCs (pDCs) in mouse tumor-draining LNs can express the immunoregulatory enzyme indoleamine 2,3-dioxygenase (IDO). We show that these IDO+ pDCs directly activate resting CD4+CD25+Foxp3+ Tregs for potent suppressor activity. In vivo, Tregs isolated from tumor-draining LNs were constitutively activated and suppressed antigen-specific T cells immediately ex vivo. In vitro, IDO+ pDCs from tumor-draining LNs rapidly activated resting Tregs from non-tumor-bearing hosts without the need for mitogen or exogenous anti-CD3 crosslinking. Treg activation by IDO+ pDCs was MHC restricted, required an intact amino acid-responsive GCN2 pathway in the Tregs, and was prevented by CTLA4 blockade. Tregs activated by IDO markedly upregulated programmed cell death 1 ligand 1 (PD-L1) and PD-L2 expression on target DCs, and the ability of Tregs to suppress target T cell proliferation was abrogated by antibodies against the programmed cell death 1/PD-L (PD-1/PD-L) pathway. In contrast, Tregs activated by anti-CD3 crosslinking did not cause upregulation of PD-Ls, and suppression by these cells was unaffected by blocking the PD-1/PD-L pathway. Tregs isolated from tumor-draining LNs in vivo showed potent PD-1/PD-L-mediated suppression, which was selectively lost when tumors were grown in IDO-deficient hosts. We hypothesize that IDO+ pDCs create a profoundly suppressive microenvironment within tumor-draining LNs via constitutive activation of Tregs.


Figures

Figure 1
Figure 1. Treg activation by DCs from TDLNs.
(A) Contralateral LNs and TDLNs from mice with B16F10 and B78H1–GM-CSF tumors (day 7–11). B16-OVA tumors were identical to B16F10. Red color identifies IDO by immunohistochemistry. One representative of 3–6 experiments per cell line. Original magnification, ×200. (B) TDLNs and contralateral LNs were stained for CD4 and intracellular Foxp3. Numbers indicate quadrant percentages. Representative of 6 experiments using B16-OVA and B78H1–GM-CSF. (C) Tregs (CD4+CD25+) from TDLNs and contralateral LNs were sorted and added to readout assays, which were comprised of 1 × 10⁵ A1 T cells plus CBA DCs plus H-Y peptide. Proliferation (incorporation of [3H]thymidine deoxyribose, [3HTdR]) is shown for a representative experiment. In all similar figures, the ratio of Tregs to A1 cells is shown below the axis (bars show SD of replicate wells). The lower graph shows data from 8 independent experiments using the tumor types shown (cpm were normalized to the proliferation in control assays receiving no Tregs, to permit comparison across experiments). (D) CD11c+ DCs were harvested from TDLNs, pulsed with OVA peptide, and injected subcutaneously into recipient mice preloaded with OT-I. One group of mice received implantable sustained-release 1MT pellets at 5 mg/day (IDO blocked), while the other received vehicle control pellets (IDO active). After 4 days, the LNs draining the site of DC injection were harvested and the Tregs sorted and tested in vitro for spontaneous suppressor activity in readout assays (A1 T cells + CBA DCs). Representative of 3 experiments; bars show SD of replicate wells.
Figure 2
Figure 2. Activation of Tregs by IDO in vitro.
(A) Resting Tregs were cocultured with TDLN pDCs plus OT-I plus feeder cells (all on B6 background, MHC b-haplotype) as described in Methods (IDO-activated Tregs). After 2 days the Tregs were re-sorted and added to readout assays (A1 T cells + CBA DCs, k-haplotype background). Controls Tregs were activated in identical cultures with 1MT added to block IDO activity. Graph shows the mean of 5–8 pooled experiments, using pDCs from B78H1–GM-CSF and B16-OVA tumors; error bars show SD. (B) Tregs were activated as described above or in identical cultures containing 1MT (to block IDO) and anti-CD3 mAb (αCD3) plus IL-2 (IDO-activated Tregs). After 2 days, Tregs were re-sorted and tested in readout assays. Data points show the means for pooled values from 3 independent experiments. (C) Tregs were activated in cocultures as described above, and APCs were either TDLN pDCs, non-pDC fraction from the same TDLN (CD11c+B220), pDCs from mice without tumors, or TDLN pDCs from IDO-KO mice. Graphs show 1 representative of 3–4 similar experiments for each group (bars show SD of replicate wells). (D) Tregs were activated with TDLN pDCs as described above, with or without 1MT. Tregs were re-sorted and added to readout assays in the lower chamber of transwell plates; upper chambers received readout assays without Tregs. Thymidine incorporation was measured separately in each chamber. One of 3 experiments; *P < 0.01 by ANOVA. (E) IDO-activated Tregs were sorted and added to readout assays containing A1 T cells plus either CBA DCs or CBA B cells. One of 3 experiments; *P < 0.01 by ANOVA.
Figure 3
Figure 3. Suppression by IDO-activated Tregs requires the PD-1/PD-L pathway.
(A) Tregs were activated with IDO+ pDCs as described in Figure 2, then 1 × 10⁴ sorted Tregs were added to readout assays (A1 T cells + CBA DCs). After 24 hours, cultures were harvested and stained for PD-L1 and PD-L2 relative to CD11c. Percentages indicate the proportion of cells that are dual-positive (right-upper quadrant). One of 3 experiments. (B) IDO-activated Tregs (5,000/well) were added to readout assays (A1 T cells plus either wild-type CBA DCs or IDO-KO DCs on the CBA background). Readout assays received either no additive, 1MT, or a cocktail of blocking antibodies against PD-1, PD-L1, and PD-L2 (50 μg/ml each). Control Tregs received 1MT during the activation step. One of 3 experiments; *P < 0.01 by ANOVA. (C) Tregs were activated with IDO+ pDCs or in identical cultures containing 1MT to block IDO and αCD3 plus IL-2 to activate the Tregs. After sorting, Tregs were added to readout assays (A1 T cells + CBA DCs) with or without PD-1/PD-L–blocking antibodies as shown. Graphs show the mean ± SD of 10 independent experiments with IDO-activated Tregs and 3 experiments with αCD3-activated Tregs, using TDLN pDCs from B78H1–GM-CSF and B16-OVA tumors. (D) IDO-activated Tregs (1 × 10⁴/well) and αCD3/IL-2–activated Tregs (2 × 10⁴/well) were prepared as described in the previous panel and added to readout assays with or without recombinant IL-2, anti–IL-10 plus anti–TGF-β blocking antibodies (100 μg/ml each), PD-1/PD-L–blocking antibodies, or no additive (-0-). Error bars show SD for replicate wells in 1 of 4 similar experiments. *P < 0.01 by ANOVA.
Figure 4
Figure 4. IDO-induced activation requires GCN2 in Tregs.
(A) Activation cultures were set up with Tregs, TDLN pDCs, OT-I, and feeder cells, with or without 1MT. After 2 days, intracellular staining was performed for CHOP expression in Tregs (CD4+ cells). The percentages show the fraction of Tregs that were CHOP+. One of 9 similar experiments. (B) As in the preceding panel, Tregs derived from wild-type mice are compared with GCN2-KO mice (each assay with OVA, without 1MT). One of 3 experiments. (C) Tregs from GCN2-KO mice or wild-type controls were activated with IDO+ pDCs as described in Figure 2 and re-sorted, and 5,000 Tregs were added to readout assays (A1 T cells + CBA DCs), with and without PD-1/PD-L–blocking antibodies. One of 3 similar experiments. *P < 0.01 by ANOVA. (D) Tregs from wild-type mice were activated with IDO+ pDCs, re-sorted, and tested in readout assays with and without added 10× tryptophan (250 mM). Bars show SD for replicate wells. One of 3 similar experiments.
Figure 5
Figure 5. MHC-dependent and MHC-independent steps in IDO-induced Treg activation.
(A) B6 Tregs were activated with IDO+ pDCs as described in Figure 2, with or without anti–CTLA4-blocking mAb (10 ug/ml) during the activation step. Activated Tregs were re-sorted and tested in readout assays (A1 T cells + CBA DCs). Bars show SD for replicate wells in 1 of 4 similar experiments. (B) CHOP induction in Tregs is MHC restricted. Cultures were set up as described in Figure 4A and cells stained for CHOP after 2 days. The left plot shows assays using Tregs that were MHC matched to the IDO+ pDCs (B6 background); the middle plot shows assays with MHC-mismatched (CBA) Tregs. The right plot shows cultures with MHC-matched B6 Tregs but with 100 μg/ml blocking antibody to IAb. Controls without blocking antibody or with irrelevant antibody were similar to the first plot and are not shown. One of 4 experiments. (C) Left: Activation cocultures were set up as described in Figure 2 using MHC-mismatched (CBA) Tregs. After 2 days, CBA Tregs were re-sorted and added to readout assays (A1 T cells + CBA DCs). Right: Identical assays, except that CBA Tregs were mixed with Thy1.1 congenic B6 Tregs (10,000 each) during the activation cocultures, then each Treg population was re-sorted and tested separately. Error bars show SD for replicate wells in 1 of 3 similar experiments, using TDLN pDCs from B78H1–GM-CSF and B16-OVA tumors.
Figure 6
Figure 6. Direct activation of mature Tregs is more potent than de novo differentiation of new Tregs.
(A) Activation cocultures were set up as described in Figure 2 using Thy1.1-congenic B6 Tregs. To these were added CD4+CD25 (naive, nonregulatory) T cells from A1 mice plus CBA spleen DCs. Parallel groups received either no H-Y antigen for the A1 cells, H-Y, or H-Y plus 1MT. (All cultures received OVA peptide for the OT-I). After 2 days, cocultures were stained for CD4, Foxp3, and Thy1.1. The smaller dot plots show similar cultures in which the A1 cells and OT-I were labeled with CFSE prior to addition, then analyzed for cell division at the end of the assay. CFSE histograms for the A1 cells (CD4+CFSE+) are superimposed. One of 4 experiments. (B) Assays were set up as described in the previous panel, using Thy1.1 congenic Tregs plus nonregulatory CD4+CD25 cells from wild-type B6 mice, activated with αCD3 mAb. Dot plots show upregulation of Foxp3 in this model using CD4+CD25 cells prelabeled with CFSE. After 2 days the Treg and non-Treg populations were sorted separately based on Thy1.1 expression and tested in readout assays (A1 T cells + CBA DCs). One of 3 similar experiments; error bars show SD.
Figure 7
Figure 7. IDO-activated Tregs in TDLNs.
(A) Tumors were grown in wild-type or IDO-KO hosts. Tregs from day 7 TDLNs were sorted and added to readout assays (A1 T cells + CBA DCs) with and without PD-1/PD-L blocking antibodies. Mean ± SD of 4 pooled experiments with B78H1–GM-CSF, 4 experiments with B16-OVA, and 3 experiments with IDO-KO hosts (2 with B78H1–GM-CSF and 1 with B16-OVA). (B) Wild-type mice were treated throughout tumor growth with vehicle control or sustained-release 1MT. Tregs from day 7 tumors were tested in readout assays as described above with added isotype, PD-1/PD-L–blocking antibodies, or a combination of anti–PD-1/PD-L plus IL-2 plus anti–IL-10/TGF-β antibodies. One of 3 experiments using B78H1–GM-CSF and B16-OVA. (C) Upper panels: CFSE-labeled OT-I were injected into mice with B16-OVA tumors (days 7–8) with and without oral 1MT administration after transfer. After 4 days, TDLNs and contralateral LNs (CLN) were stained for the 1B11 activation marker. Percentages show the CFSE+ OT-I in total LN cells. Histogram shows 1B11 on OT-I in TDLNs. Representative of 4 transfers each. Lower panels: Similar experiments as described above using OT-IGCN2-KO cells transferred into WT or GCN2-KO hosts bearing B16-OVA tumors. One of 3 similar experiments. (D) B78H1–GM-CSF tumors were treated on day 11 with vehicle (control), cyclophosphamide (CY; 150 mg/kg), or cyclophosphamide plus 1MT pellets. Seven days later cells from TDLNs were harvested and added to readout assays (allospecific BM3 T cells plus B6 splenocytes, as described in ref. 1). One group in each readout assay also received 1MT added during the assay, as shown on the last bar of each graph. One of 3 experiments.
Figure 8
Figure 8. Proposed hypothetical model of IDO-induced Treg activation based on synthesis of results from the in vitro models.
The interaction of resting Tregs with IDO+ pDCs results in activation of the Tregs through a combination of the GCN2 activation and tryptophan metabolites. Activated Tregs then suppress target T cells in an IDO-independent fashion, involving PD-ligand expression on the target DCs, and PD-1 expression (presumably on the target T cells). In addition, bystander CD4+ T cells responding to other antigens, if exposed to the conditions created by activating Tregs and IDO+ pDCs, are biased to differentiate into new Tregs.

Similar articles

Cited by

References

    1. Munn D.H., et al. Expression of indoleamine 2,3-dioxygenase by plasmacytoid dendritic cells in tumor-draining lymph nodes. J. Clin. Invest. 2004;114:280–290. - PMC - PubMed
    1. Munn D.H., et al. Prevention of allogeneic fetal rejection by tryptophan catabolism. Science. 1998;281:1191–1193. - PubMed
    1. Gurtner G.J., et al. Inhibition of indoleamine 2,3-dioxygenase augments trinitrobenzene sulfonic acid colitis in mice. Gastroenterology. 2003;125:1762–1773. - PubMed
    1. Liu H., Liu L., Fletcher B.S., Visner G.A. Sleeping Beauty-based gene therapy with indoleamine 2,3-dioxygenase inhibits lung allograft fibrosis. FASEB J. 2006;20:2384–2386. - PubMed
    1. Uyttenhove C., et al. Evidence for a tumoral immune resistance mechanism based on tryptophan degradation by indoleamine 2,3-dioxygenase. Nat. Med. 2003;9:1269–1274. - PubMed

Publication types

MeSH terms