

The use of diagnostic frequency continuous ultrasound to improve microcirculatory function after ischemia-reperfusion injury
- PMID: 17710628
- PMCID: PMC2597308
- DOI: 10.1080/10739680701410280
The use of diagnostic frequency continuous ultrasound to improve microcirculatory function after ischemia-reperfusion injury
Abstract
Objective: Damage to the circulatory system resulting from ischemia-reperfusion injury (I/R injury) occurs during heart attacks and hemorrhagic shock. The authors report a method for mitigating microcirculatory injury, using diagnostic frequency continuous-mode ultrasound and how effects are influenced by nitric oxide production impairment.
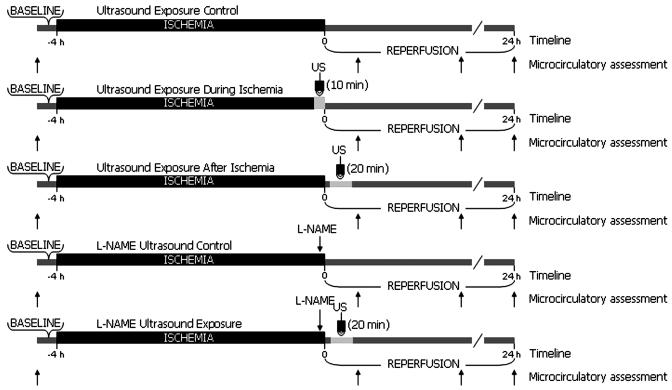
Methods: Five groups of hamsters were studied using the dorsal skin fold window chamber: (1) I/R; (2) I/R + ultrasound during ischemia; (3) I/R + ultrasound after ischemia; (4) I/R + N(omega)-nitro-L-arginine methyl ester (L-NAME); and (5) I/R + L-NAME + ultrasound. Functional capillary density (FCD) and microvascular diameter, flow velocity, and flow were monitored. During the exposures 2.49 MHz continuous ultrasound was used.
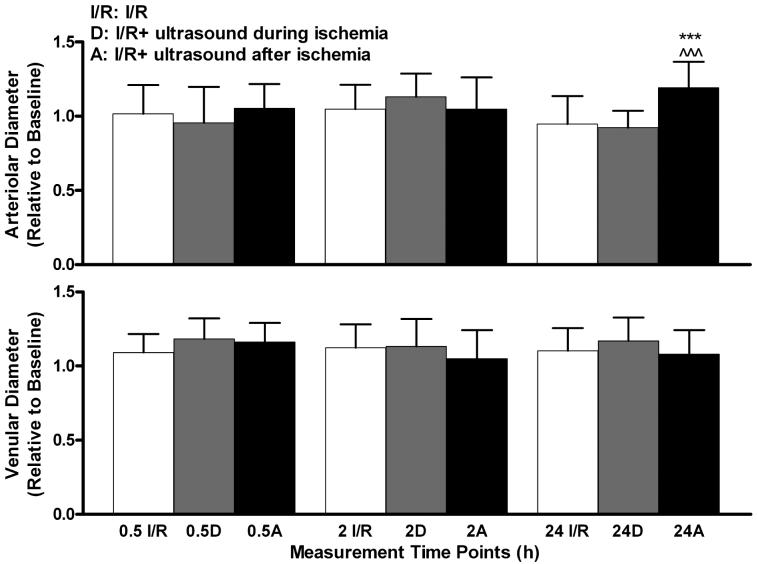
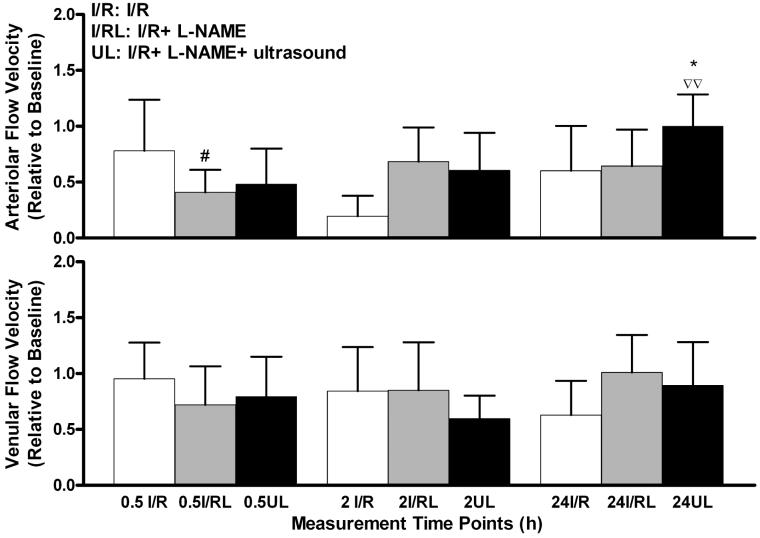
Results: Significant improvements in animals exposed to ultrasound after ischemia were found at 24 h of reperfusion in FCD, arteriolar diameter, and arteriolar and venular flow velocity and flow. Animals exposed to ultrasound during ischemia showed significantly improved FCD. L-NAME treatment reduced the improvement of microvascular function, compared to animals exposed after ischemia.
Conclusions: The use of continuous-mode diagnostic frequency ultrasound is beneficial in preventing long-term ischemia-reperfusion effects in the microcirculation as shown by the return of microvascular parameters to baseline values, an effect not attained in the absence of ultrasound treatment. The effects may be in part due to the production of nitric oxide consequent to locally induced shear stress effects by ultrasound exposure.
Figures


Similar articles
-
Early iNOS impairment and late eNOS enhancement during reperfusion following 2.49 MHz continuous ultrasound exposure after ischemia.Ultrason Sonochem. 2009 Jan;16(1):197-203. doi: 10.1016/j.ultsonch.2008.05.007. Epub 2008 May 24. Ultrason Sonochem. 2009. PMID: 18595762 Free PMC article.
-
Intermittent hypoxia modulates nitric oxide-dependent vasodilation and capillary perfusion during ischemia-reperfusion-induced damage.Am J Physiol Heart Circ Physiol. 2008 Apr;294(4):H1914-22. doi: 10.1152/ajpheart.01371.2007. Epub 2008 Feb 22. Am J Physiol Heart Circ Physiol. 2008. PMID: 18296561
-
Involvement of nitric oxide in microcirculatory reactions after ischemia-reperfusion of the rat urinary bladder.Eur Surg Res. 2009;42(1):28-34. doi: 10.1159/000167854. Epub 2008 Nov 6. Eur Surg Res. 2009. PMID: 18987471
-
Pial microvascular responses to transient bilateral common carotid artery occlusion: effects of hypertonic glycerol.J Vasc Res. 2008;45(2):89-102. doi: 10.1159/000109818. Epub 2007 Oct 12. J Vasc Res. 2008. PMID: 17934320
-
Effects of diagnostic cardiac ultrasound on oxygen free radical production and microvascular perfusion during ischemia reperfusion.Ultrasound Med Biol. 2004 Apr;30(4):549-57. doi: 10.1016/j.ultrasmedbio.2003.12.008. Ultrasound Med Biol. 2004. PMID: 15121258
Cited by
-
Therapeutic Ultrasound Increases Myocardial Blood Flow in Ischemic Myocardium and Cardiac Endothelial Cells: Results of In Vivo and In Vitro Experiments.J Am Soc Echocardiogr. 2019 Sep;32(9):1151-1160. doi: 10.1016/j.echo.2019.05.012. Epub 2019 Jul 1. J Am Soc Echocardiogr. 2019. PMID: 31272838 Free PMC article.
-
3D-printed lightweight dorsal skin fold chambers from PEEK reduce chamber-related animal distress.Sci Rep. 2022 Jul 8;12(1):11599. doi: 10.1038/s41598-022-13924-5. Sci Rep. 2022. PMID: 35803979 Free PMC article.
-
Early iNOS impairment and late eNOS enhancement during reperfusion following 2.49 MHz continuous ultrasound exposure after ischemia.Ultrason Sonochem. 2009 Jan;16(1):197-203. doi: 10.1016/j.ultsonch.2008.05.007. Epub 2008 May 24. Ultrason Sonochem. 2009. PMID: 18595762 Free PMC article.
-
Low-intensity pulsed ultrasound stimulation in different regions in the viability of myocutaneous flaps.J Ther Ultrasound. 2016 Oct 21;4:25. doi: 10.1186/s40349-016-0069-4. eCollection 2016. J Ther Ultrasound. 2016. PMID: 27785362 Free PMC article.
-
Viability of transverse rectus abdominis musculocutaneous flap treated with photobiomodulation and therapeutic ultrasound: an experimental model.Lasers Med Sci. 2022 Feb;37(1):461-470. doi: 10.1007/s10103-021-03283-4. Epub 2021 Mar 16. Lasers Med Sci. 2022. PMID: 33725203
References
-
- Alexandrov AV, Molina CA, Grotta JC, Garami Z, Ford SR, Alvarez-Sabin J, Montaner J, Saqqur M, Demchuk AM, Moye LA, Hill MD, Wojner AW. Ultrasound-enhanced systemic thrombolysis for acute ischemic stroke. N Engl J Med. 2004;351:2170–2178. - PubMed
-
- Becker BF, Kupatt C, Massoudy P, Zahler S. Reactive oxygen species and nitric oxide in myocardial ischemia and reperfusion. Z Kardiol. 2000;89(Suppl 9):IX/88–91. - PubMed
-
- Bertuglia S, Giusti A. Microvascular oxygenation, oxidative stress, NO suppression and superoxide dismutase during postischemic reperfusion. Am J Physiol Heart Circ Physiol. 2003;285:H1064–H1071. - PubMed
-
- Bertuglia S, Giusti A. Influence of ACTH-(1-24) and plasma hyperviscosity on free radical production and capillary perfusion after hemorrhagic shock. Microcirculation. 2004;11:227–238. - PubMed
-
- Bertuglia S, Giusti A, Picano E. Effects of diagnostic cardiac ultrasound on oxygen free radical production and microvascular perfusion during ischemia reperfusion. Ultrasound Med Biol. 2004;30:549–557. - PubMed
Publication types
MeSH terms
Substances
Grants and funding
LinkOut - more resources
Full Text Sources
