

Overview of model-building strategies in population PK/PD analyses: 2002-2004 literature survey
- PMID: 17711538
- PMCID: PMC2203272
- DOI: 10.1111/j.1365-2125.2007.02975.x
Overview of model-building strategies in population PK/PD analyses: 2002-2004 literature survey
Abstract
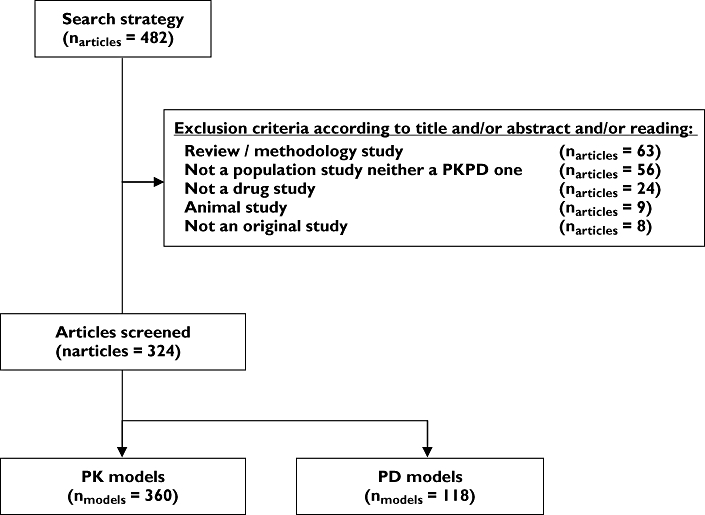
Aims: A descriptive survey of published population pharmacokinetic and/or pharmacodynamic (PK/PD) analyses from 2002 to 2004 was conducted and an evaluation made of how model building was performed and reported.
Methods: We selected 324 articles in Pubmed using defined keywords. A data abstraction form (DAF) was then built comprising two parts: general characteristics including article identification, context of the analysis, description of clinical studies from which the data arose, and model building, including description of the processes of modelling. The papers were examined by two readers, who extracted the relevant information and transmitted it directly to a MySQL database, from which descriptive statistical analysis was performed.
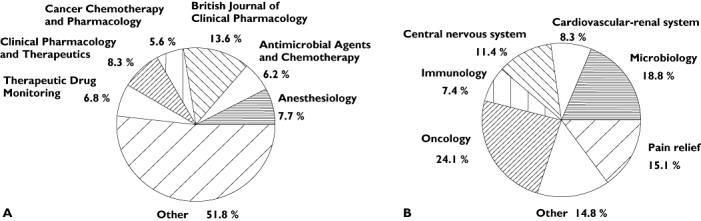
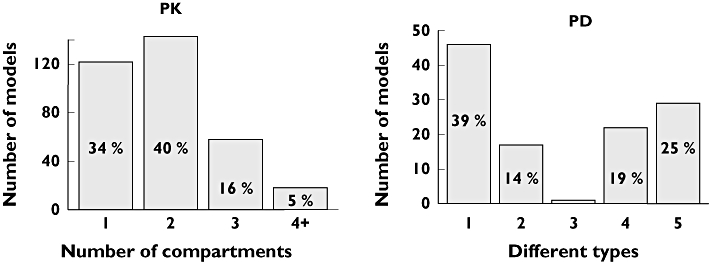
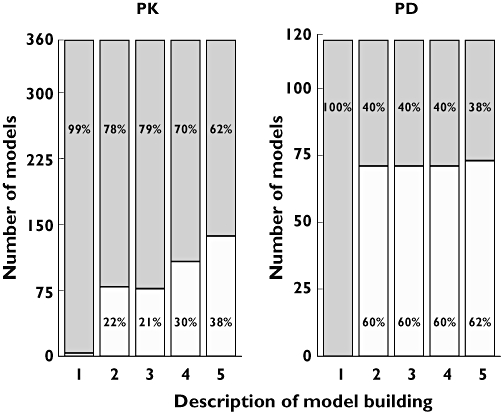
Results: Most published papers concerned patients with severe pathology and therapeutic classes suffering from narrow therapeutic index and/or high PK/PD variability. Most of the time, modelling was performed for descriptive purposes, with rich rather than sparse data and using NONMEM software. PK and PD models were rarely complex (one or two compartments for PK; E(max) for PD models). Covariate testing was frequently performed and essentially based on the likelihood ratio test. Based on a minimal list of items that should systematically be found in a population PK-PD analysis, it was found that only 39% and 8.5% of the PK and PD analyses, respectively, published from 2002 to 2004 provided sufficient detail to support the model-building methodology.
Conclusions: This survey allowed an efficient description of recent published population analyses, but also revealed deficiencies in reporting information on model building.
Figures
 ); No, (□))
Comment in
-
Commentary on Dartois et al.--model building in population PK-PD analyses. A 2002-2004 literature survey.Br J Clin Pharmacol. 2007 Nov;64(5):578-9. doi: 10.1111/j.1365-2125.2007.02973.x. Epub 2007 Aug 31. Br J Clin Pharmacol. 2007. PMID: 17764478 Free PMC article. No abstract available.
Similar articles
-
A survey of population analysis methods and software for complex pharmacokinetic and pharmacodynamic models with examples.AAPS J. 2007 Mar 2;9(1):E60-83. doi: 10.1208/aapsj0901007. AAPS J. 2007. PMID: 17408237 Free PMC article. Review.
-
Pharmacometrics: modelling and simulation tools to improve decision making in clinical drug development.Eur J Drug Metab Pharmacokinet. 2000 Jan-Mar;25(1):49-58. doi: 10.1007/BF03190058. Eur J Drug Metab Pharmacokinet. 2000. PMID: 11032091
-
Comparison of stepwise covariate model building strategies in population pharmacokinetic-pharmacodynamic analysis.AAPS PharmSci. 2002;4(4):E27. doi: 10.1208/ps040427. AAPS PharmSci. 2002. PMID: 12645999 Free PMC article.
-
Commentary on Dartois et al.--model building in population PK-PD analyses. A 2002-2004 literature survey.Br J Clin Pharmacol. 2007 Nov;64(5):578-9. doi: 10.1111/j.1365-2125.2007.02973.x. Epub 2007 Aug 31. Br J Clin Pharmacol. 2007. PMID: 17764478 Free PMC article. No abstract available.
-
Basic concepts of pharmacokinetic/pharmacodynamic (PK/PD) modelling.Int J Clin Pharmacol Ther. 1997 Oct;35(10):401-13. Int J Clin Pharmacol Ther. 1997. PMID: 9352388 Review.
Cited by
-
Early prediction of treatment resistance in low-risk gestational trophoblastic neoplasia using population kinetic modelling of hCG measurements.Br J Cancer. 2013 May 14;108(9):1810-6. doi: 10.1038/bjc.2013.123. Epub 2013 Apr 16. Br J Cancer. 2013. PMID: 23591194 Free PMC article.
-
Limited sampling strategy and population pharmacokinetic model of mycophenolic acid in pediatric patients with systemic lupus erythematosus: application of a double gamma absorption model with SAEM algorithm.Eur J Clin Pharmacol. 2024 Jan;80(1):83-92. doi: 10.1007/s00228-023-03587-0. Epub 2023 Oct 28. Eur J Clin Pharmacol. 2024. PMID: 37897528
-
Prognostic Value of the Modeled Prostate-Specific Antigen KELIM Confirmation in Metastatic Castration-Resistant Prostate Cancer Treated With Taxanes in FIRSTANA.JCO Clin Cancer Inform. 2024 Feb;8:e2300208. doi: 10.1200/CCI.23.00208. JCO Clin Cancer Inform. 2024. PMID: 38364191 Free PMC article.
-
Population pharmacokinetic analyses of tacrolimus in non-transplant patients: a systematic review.Eur J Clin Pharmacol. 2023 Jul;79(7):897-913. doi: 10.1007/s00228-023-03503-6. Epub 2023 Jun 1. Eur J Clin Pharmacol. 2023. PMID: 37261481
-
How to optimise drug study design: pharmacokinetics and pharmacodynamics studies introduced to paediatricians.J Pharm Pharmacol. 2017 Apr;69(4):439-447. doi: 10.1111/jphp.12637. Epub 2016 Sep 27. J Pharm Pharmacol. 2017. PMID: 27671925 Free PMC article. Review.
References
-
- Sheiner LB, Rosenberg B, Melmon KL. Modelling of individual pharmacokinetics for computer-aided drug dosage. Comput Biomed Res. 1972;5:411–59. - PubMed
-
- Sheiner LB, Rosenberg B, Marathe VV. Estimation of population characteristics of pharmacokinetic parameters from routine clinical data. J Pharmacokinet Biopharm. 1977;5:445–79. - PubMed
-
- Mentré F, Ebelin ME. Validation of population pharmacokinetic/pharmacodynamic analyses: review of proposed approaches. In: Aarons L, Balant LP, Danhof M, et al., editors. COST B1. European Cooperation in the Field of Scientific and Technical Research. The Population Approach. Measuring and Managing Variability in Response, Concentration and Dose. Brussels: Office for Official Publications of the European Communities; 1997. pp. 148–60.
-
- Pillai GC, Mentré F, Steimer JL. Non-linear mixed effects modeling—from methodology and software development to driving implementation in drug development science. J Pharmacokinet Pharmacodyn. 2005;32:161–83. - PubMed
-
- Sheiner LB, Steimer JL. Pharmacokinetic/pharmacodynamic modeling in drug development. Annu Rev Pharmacol Toxicol. 2000;40:67–95. - PubMed
Publication types
MeSH terms
LinkOut - more resources
Full Text Sources
Miscellaneous
