

Image-guided helical tomotherapy for localized prostate cancer: technique and initial clinical observations
- PMID: 17712296
- PMCID: PMC5722601
- DOI: 10.1120/jacmp.v8i3.2320
Image-guided helical tomotherapy for localized prostate cancer: technique and initial clinical observations
Abstract
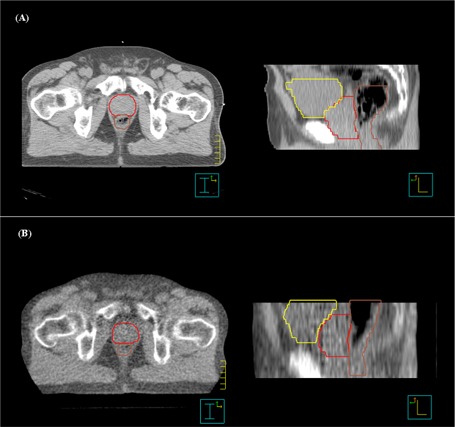
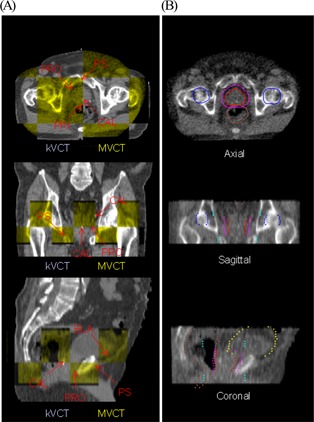
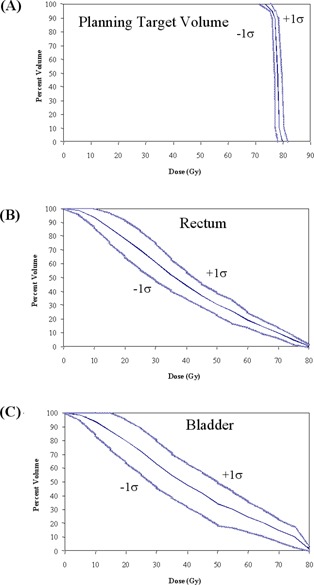
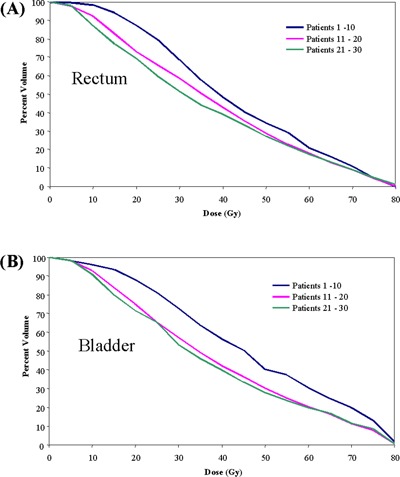
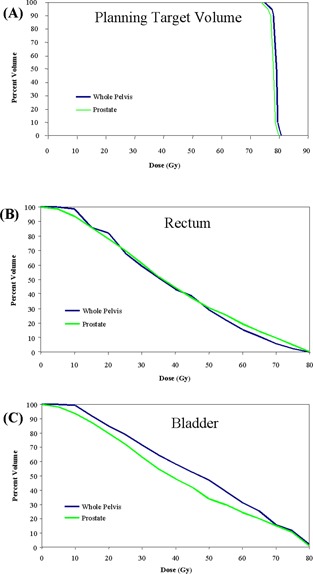
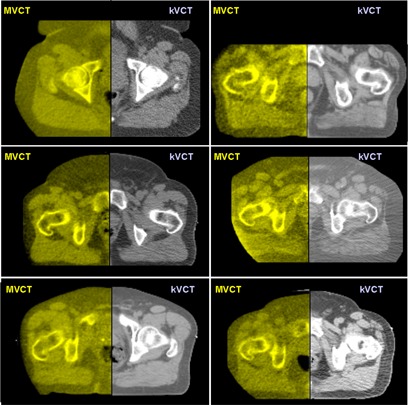
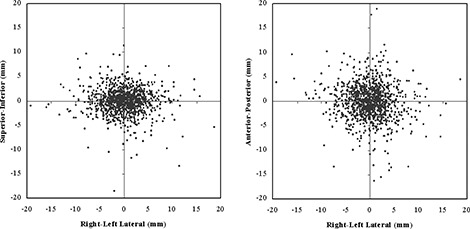
The purpose of the present study was to implement a technique for daily computed tomography (CT)-based image-guided radiation therapy and to report observations on treatment planning, imaging, and delivery based on the first 2 years of clinical experience. Patients with previously untreated stage T1-T3 biopsy-proven adenocarcinoma of the prostate were considered eligible for treatment with daily CT-guided helical tomotherapy. The prostate was targeted daily using megavoltage CT (MVCT) images that were fused with treatment-planning CT images based on anatomic alignments. All patients were treated at 2 Gy per fraction to 76-78 Gy (mean: 76.7 Gy). As part of this study, 33 prostate patients were planned, imaged, and treated with a total of 1266 CT-guided fractions. The prostate, rectum, bladder, femoral heads, and pubis symphysis were visible in one or more slices for all 1266 MVCT image sets. The typical range of measured prostate displacement relative to a 3-point external laser setup in this study was 2-10 mm [3.4 mm standard deviation (SD)] in the anterior-posterior direction, 2-8 mm (3.7 mm SD) in the lateral direction, and 1-6 mm (2.4 mm SD) in the superior-inferior direction. The obese patients in this study had a substantially larger lateral variation (8.2 mm SD) attributable to mobility of skin marks. The prostate, seminal vesicles, rectum, and bladder anatomy were used to position the patient relative to the desired treatment position without the use of implanted markers. Acute toxicities were within the expected range given the number of patients treated and the dose level.
Figures
Similar articles
-
Radiobiological and dosimetric analysis of daily megavoltage CT registration on adaptive radiotherapy with Helical Tomotherapy.Technol Cancer Res Treat. 2011 Feb;10(1):1-13. doi: 10.7785/tcrt.2012.500175. Technol Cancer Res Treat. 2011. PMID: 21214283
-
Evidence of limited motion of the prostate by carefully emptying the rectum as assessed by daily MVCT image guidance with helical tomotherapy.Int J Radiat Oncol Biol Phys. 2008 Jun 1;71(2):611-7. doi: 10.1016/j.ijrobp.2008.01.048. Epub 2008 Apr 18. Int J Radiat Oncol Biol Phys. 2008. PMID: 18374511
-
Helical tomotherapy. Experiences of the first 150 patients in Heidelberg.Strahlenther Onkol. 2008 Jan;184(1):8-14. doi: 10.1007/s00066-008-1778-6. Strahlenther Onkol. 2008. PMID: 18188517
-
Megavoltage CT in helical tomotherapy - clinical advantages and limitations of special physical characteristics.Technol Cancer Res Treat. 2009 Oct;8(5):343-52. doi: 10.1177/153303460900800504. Technol Cancer Res Treat. 2009. PMID: 19754210
-
Megavoltage CT images of helical tomotherapy unit for radiation treatment simulation: impact on feasibility of treatment planning in a prostate cancer patient with bilateral femoral prostheses.Tumori. 2011 Mar-Apr;97(2):221-4. doi: 10.1177/030089161109700215. Tumori. 2011. PMID: 21617719 Review.
Cited by
-
Comparison of daily couch shifts using MVCT (TomoTherapy) and B-mode ultrasound (BAT System) during prostate radiotherapy.Technol Cancer Res Treat. 2008 Aug;7(4):279-85. doi: 10.1177/153303460800700402. Technol Cancer Res Treat. 2008. PMID: 18642966 Free PMC article.
-
ACR Appropriateness Criteria® external beam radiation therapy treatment planning for clinically localized prostate cancer, part I of II.Adv Radiat Oncol. 2016 Oct 20;2(1):62-84. doi: 10.1016/j.adro.2016.10.002. eCollection 2017 Jan-Mar. Adv Radiat Oncol. 2016. PMID: 28740916 Free PMC article. Review. No abstract available.
-
Determining efficient helical IMRT modulation factor from the MLC leaf-open time distribution on precision treatment planning system.J Appl Clin Med Phys. 2019 May;20(5):64-74. doi: 10.1002/acm2.12581. Epub 2019 Apr 8. J Appl Clin Med Phys. 2019. PMID: 30957967 Free PMC article.
-
ACR Appropriateness Criteria for external beam radiation therapy treatment planning for clinically localized prostate cancer, part II of II.Adv Radiat Oncol. 2017 Mar 20;2(3):437-454. doi: 10.1016/j.adro.2017.03.003. eCollection 2017 Jul-Sep. Adv Radiat Oncol. 2017. PMID: 29114613 Free PMC article. Review.
-
Image guidance protocols: balancing imaging parameters against scan time.Br J Radiol. 2013 Dec;86(1032):20130385. doi: 10.1259/bjr.20130385. Epub 2013 Oct 15. Br J Radiol. 2013. PMID: 24128423 Free PMC article.
References
-
- Cox JA, Zagoria RJ, Raben M. Prostate cancer: comparison of retrograde urethrography and computed tomography in radiotherapy planning. Int J Radiat Oncol Biol Phys. 1994; 29 (5): 1119–1123. - PubMed
-
- van Herk M, Bruce A, Guss Krose AP, Shouman T, Touw A, Lebesque JV. Quantification of organ motion during conformal radiotherapy of the prostate by three dimensional image registration. Int J Radiat Oncol Biol Phys. 1995; 33 (5): 1311–1320. - PubMed
-
- Roeske JC, Forman JD, Mesina CF, et al. Evaluation of changes in the size and location of the prostate, seminal vesicles, bladder, and rectum during a course of external beam radiation therapy. Int J Radiat Oncol Biol Phys. 1995; 33 (5): 1321–1329. - PubMed
-
- Crook JM, Raymond Y, Salhani D, Yang H, Esche B. Prostate motion during standard radiotherapy as assessed by fiducial markers. Radiother Oncol. 1995; 37 (1): 35–42. - PubMed
-
- Beard CJ, Kijewski P, Bussiere M, et al. Analysis of prostate and seminal vesicle motion: implications for treatment planning. Int J Radiat Oncol Biol Phys. 1996; 34 (2): 451–458. - PubMed
Publication types
MeSH terms
LinkOut - more resources
Full Text Sources
Medical
Research Materials
