. 2007 Aug 22;2(8):e771.
doi: 10.1371/journal.pone.0000771.

Prefrontal cortex and somatosensory cortex in tactile crossmodal association: an independent component analysis of ERP recordings

Affiliations

Prefrontal cortex and somatosensory cortex in tactile crossmodal association: an independent component analysis of ERP recordings

Yixuan Ku et al. PLoS One. .

Abstract

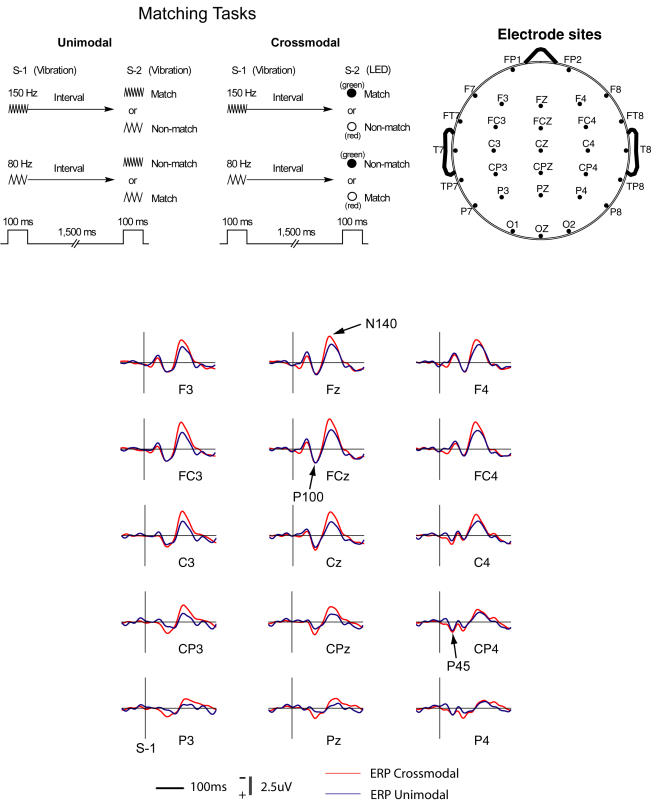
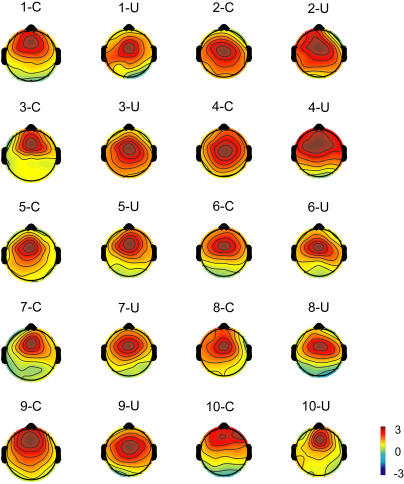
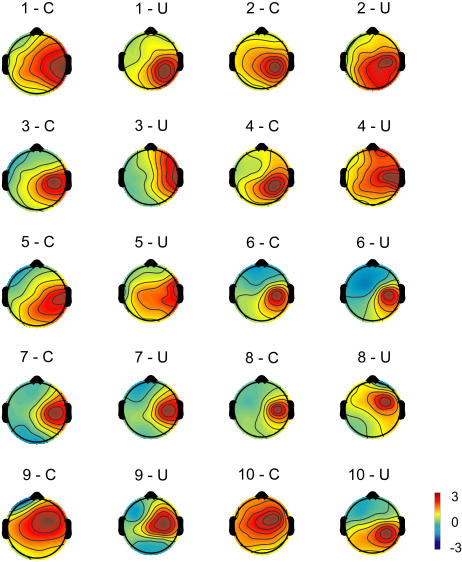
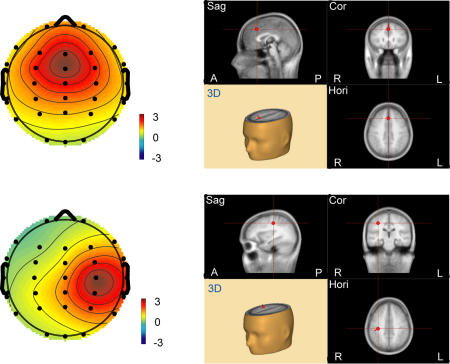
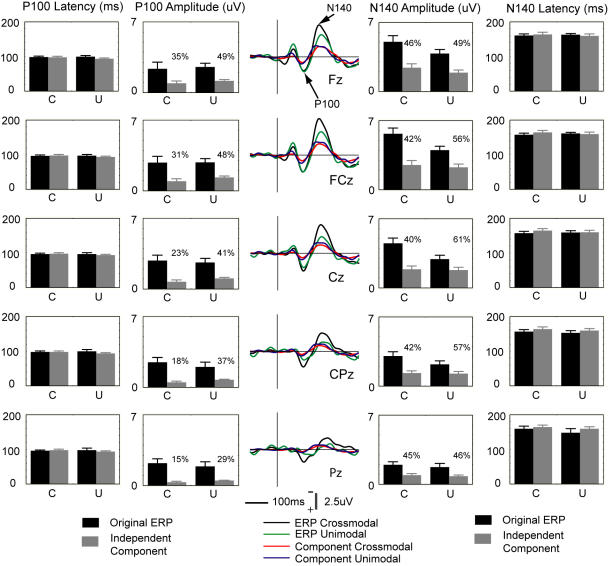
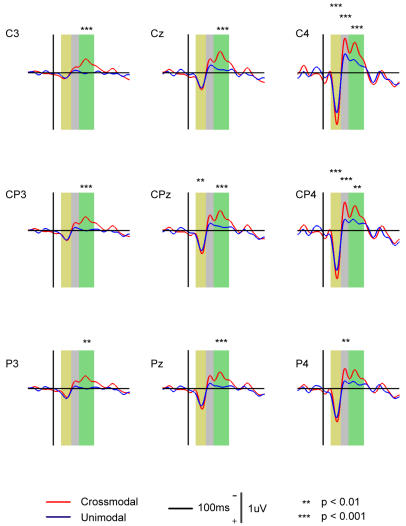
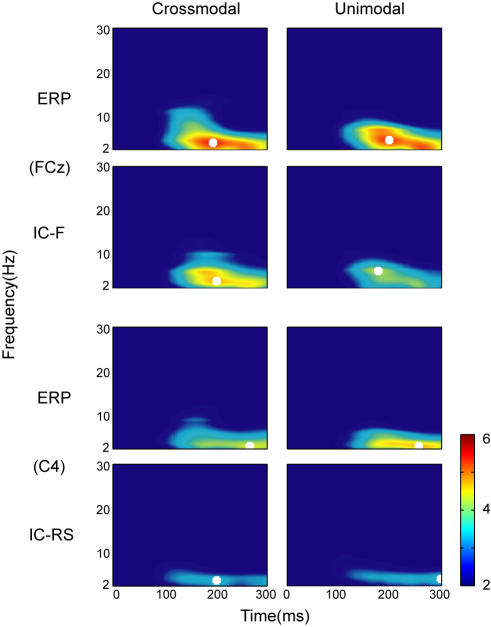
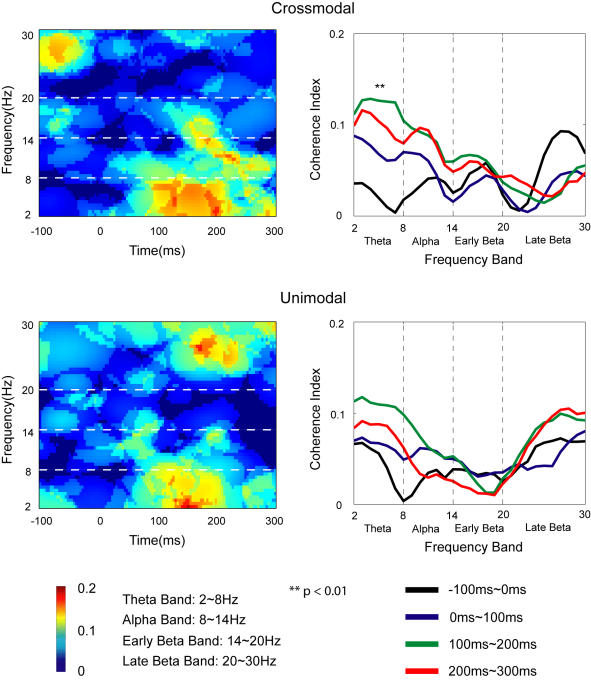
Our previous studies on scalp-recorded event-related potentials (ERPs) showed that somatosensory N140 evoked by a tactile vibration in working memory tasks was enhanced when human subjects expected a coming visual stimulus that had been paired with the tactile stimulus. The results suggested that such enhancement represented the cortical activities involved in tactile-visual crossmodal association. In the present study, we further hypothesized that the enhancement represented the neural activities in somatosensory and frontal cortices in the crossmodal association. By applying independent component analysis (ICA) to the ERP data, we found independent components (ICs) located in the medial prefrontal cortex (around the anterior cingulate cortex, ACC) and the primary somatosensory cortex (SI). The activity represented by the IC in SI cortex showed enhancement in expectation of the visual stimulus. Such differential activity thus suggested the participation of SI cortex in the task-related crossmodal association. Further, the coherence analysis and the Granger causality spectral analysis of the ICs showed that SI cortex appeared to cooperate with ACC in attention and perception of the tactile stimulus in crossmodal association. The results of our study support with new evidence an important idea in cortical neurophysiology: higher cognitive operations develop from the modality-specific sensory cortices (in the present study, SI cortex) that are involved in sensation and perception of various stimuli.


Conflict of interest statement

Competing Interests: The authors have declared that no competing interests exist.

Figures

Figure 1
Figure 1. Tasks and scalp electrode distributions.
Upper-left: Schematic description of delayed matching-to-sample tasks. In the unimodal matching task, stimulus-1 (S-1) is a tactile vibration (150 Hz or 80 Hz) delivered on the subject's left index fingertip. Stimulus-2 (S-2) is also a tactile vibration. In the crossmodal matching task, S-2 is a light (red or green) from a light-emitting diode (LED) presented in front of the subject at eye level. The green light matches high frequency and the red light, low frequency. Upper-right: a top view of scalp electrode distributions. Nose and ears are shown in the diagram. Ag-AgCl electrodes are in a standard arrangement for locations. Lower: Grand average ERPs recorded in performance of the matching tasks. ERP components P45, P100, and N140 are indicated by arrows. The ERPs are time-locked to the onset of stimulus-1 (S-1).
Figure 2
Figure 2. Topographic maps of an independent component (IC-F) located in frontal areas.
Color-scale shows the value of the projection coefficient of the component. The topography of the IC-F is consistent across subjects (n = 10, indicated by numbers) and between tasks, unimodal (U) and crossmodal (C).
Figure 3
Figure 3. Topographic maps of an independent component (IC-RS) located in right somatosensory areas.
Figure 4
Figure 4. The average topography of IC-F (upper-left) and IC-RS (lower-left), and the corresponding BESA fitting dipole positions.
The grand mean of the topographic maps is from 10 subjects across the tasks. Dipoles indicating the source of the components are located in medial prefrontal areas (IC-F, upper-right) and somatosensory areas (IC-RS, lower-right) respectively. Image views of the brain for each component are (clockwise from the top-left): sagittal (Sag), coronal (Cor), horizontal (Hori), and three-dimensional (3D). A: anterior; P: posterior; L: left; R: right.
Figure 5
Figure 5. Comparisons of ERP components and IC projections.
Left: Comparisons of latency and amplitude of ERP component P100 and IC-F projections. Middle: Grand averages of the original ERPs recorded from those midline electrodes, and grand average back-projections of the IC-F component to those electrodes. Right: Comparisons of latency and amplitude of ERP component N140 and IC-F projections. The percentage number indicates the proportion of potential that the IC-F contributes to the original ERP N140. C: crossmodal. U: unimodal. In bar graphs, the range of the ordinate for latency of P100 and N140 is 0–200 ms; the range of the ordinate for absolute values of amplitude of P100 and N140 is 0–7 uV. Error bars represent SEMs in this figure and other figures.
Figure 6
Figure 6. Grand averages of the original ERPs recorded at the electrodes (C4, CP4, and P4) contralateral to the tactile stimulus, and also at those (C3, CP3, and P3) ipsilateral to it.
ERP component P45 is shown at those contralateral electrodes. Grand average back-projections of the IC-RS component to those electrodes are also shown, where the projections have the largest peaks. Note those ERP P45 peaks and IC-RS back-projections are similar in both latency and amplitude.
Figure 7
Figure 7. Grand average back-projections of the IC-RS.
The significant difference in the projections at the electrodes between unimodal and crossmodal tasks are labeled with asterisks in three durations: 30∼70 ms (yellow), 70∼100 ms (gray), 100∼160 ms (green).
Figure 8
Figure 8. Time-frequency representation (TFR) for IC-F and the original ERPs at FCz (upper), and for IC-RS and the original ERPs at C4 (lower).
Results are the average of all trials over 10 subjects and displayed in units of standard deviation of the baseline. Time zero is the onset of stimulus-1 in the tasks, crossmodal and unimodal. The peak frequency is indicated by a white square in each corresponding representation.
Figure 9
Figure 9. Average coherence between IC-F and IC-RS across subjects.
Upper: Results in the crossmodal task; Lower: Results in the unimodal task. Time-frequency representation of coherence index is shown on the left side for both tasks. The coherence index across different frequency bands during different time durations is shown on the right side for the tasks. Post hoc (Tukey HSD) test shows that the theta-band coherence during 100∼200 ms is significantly different from the baseline (−100∼0 ms) in the crossmodal task.
Figure 10
Figure 10. Granger causality analysis between IC-F and IC-RS for the crossmodal task.
Post hoc (Tukey HSD) test shows that in the theta band the bottom-up connectivity in the period of 100∼200 ms is significantly stronger than that in the baseline (−100∼0 ms). Top-down: Granger causality from IC-F to IC-RS; Bottom-up: Granger causality from IC-RS to IC-F.

References

    1. Zhou YD, Fuster JM. Mnemonic neuronal activity in somatosensory cortex. Proc Natl Acad Sci U S A. 1996;93:10533–10537. - PMC - PubMed
    1. Bodner M, Zhou YD, Fuster JM. Binary mapping of cortical spike trains in short-term memory. J Neurophysiol. 1997;77:2219–2222. - PubMed
    1. Salinas E, Hernandez A, Zainos A, Romo R. Periodicity and firing rate as candidate neural codes for the frequency of vibrotactile stimuli. J Neurosci. 2000;20:5503–5515. - PMC - PubMed
    1. Romo R, Salinas E. Flutter discrimination: neural codes, perception, memory and decision making. Nat Rev Neurosci. 2003;4:203–218. - PubMed
    1. Harris JA, Miniussi C, Harris IM, Diamond ME. Transient Storage of a Tactile Memory Trace in Primary Somatosensory Cortex. J Neurosci. 2002;22:8720–8725. - PMC - PubMed

Publication types

MeSH terms