. 2007 Aug 22;2(8):e776.
doi: 10.1371/journal.pone.0000776.

Sequential logic model deciphers dynamic transcriptional control of gene expressions

Affiliations

Sequential logic model deciphers dynamic transcriptional control of gene expressions

Zhen Xuan Yeo et al. PLoS One. .

Abstract

Background: Cellular signaling involves a sequence of events from ligand binding to membrane receptors through transcription factors activation and the induction of mRNA expression. The transcriptional-regulatory system plays a pivotal role in the control of gene expression. A novel computational approach to the study of gene regulation circuits is presented here.

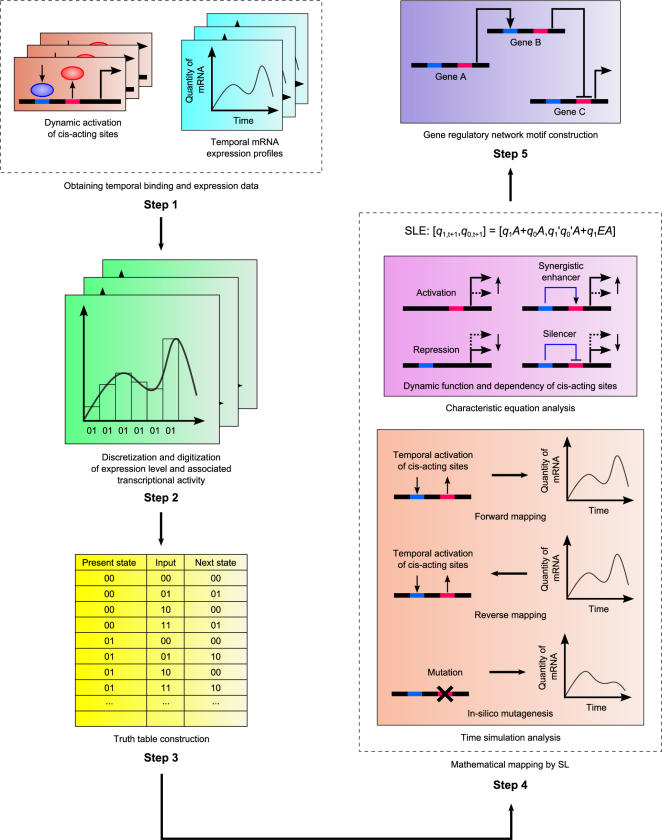
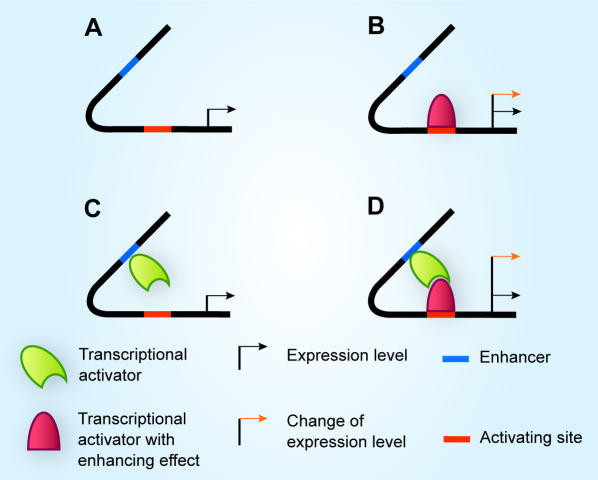
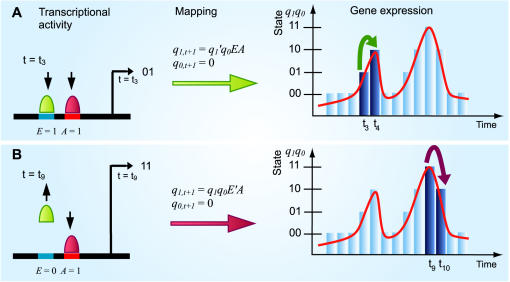
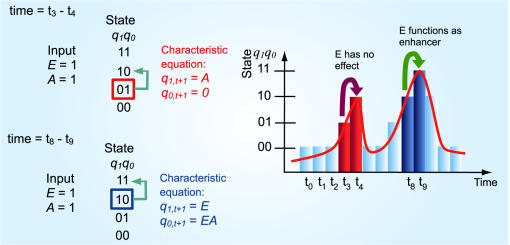
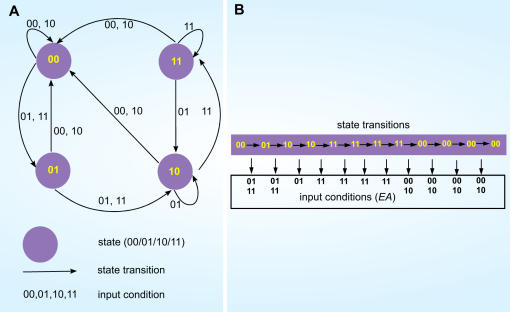
Methodology: Based on the concept of finite state machine, which provides a discrete view of gene regulation, a novel sequential logic model (SLM) is developed to decipher control mechanisms of dynamic transcriptional regulation of gene expressions. The SLM technique is also used to systematically analyze the dynamic function of transcriptional inputs, the dependency and cooperativity, such as synergy effect, among the binding sites with respect to when, how much and how fast the gene of interest is expressed.

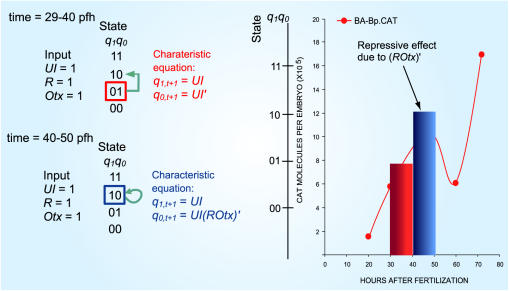
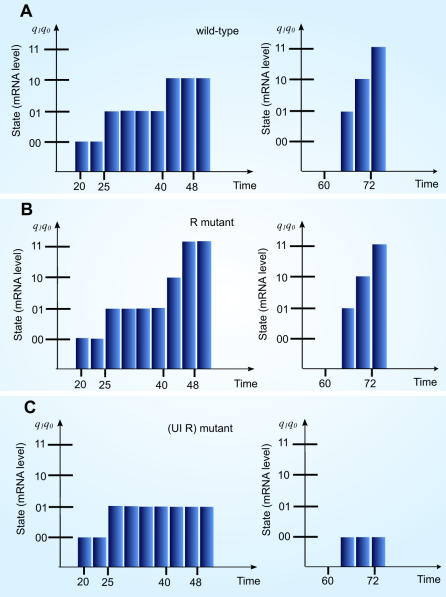
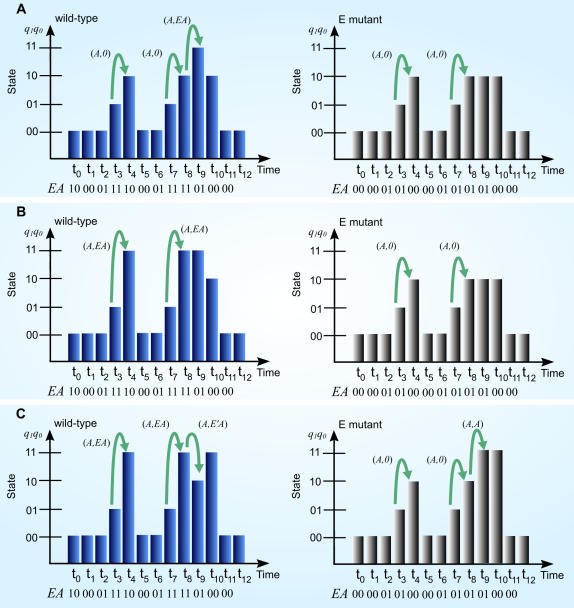
Principal findings: SLM is verified by a set of well studied expression data on endo16 of Strongylocentrotus purpuratus (sea urchin) during the embryonic midgut development. A dynamic regulatory mechanism for endo16 expression controlled by three binding sites, UI, R and Otx is identified and demonstrated to be consistent with experimental findings. Furthermore, we show that during transition from specification to differentiation in wild type endo16 expression profile, SLM reveals three binary activities are not sufficient to explain the transcriptional regulation of endo16 expression and additional activities of binding sites are required. Further analyses suggest detailed mechanism of R switch activity where indirect dependency occurs in between UI activity and R switch during specification to differentiation stage.

Conclusions/significance: The sequential logic formalism allows for a simplification of regulation network dynamics going from a continuous to a discrete representation of gene activation in time. In effect our SLM is non-parametric and model-independent, yet providing rich biological insight. The demonstration of the efficacy of this approach in endo16 is a promising step for further application of the proposed method.


Conflict of interest statement

Competing Interests: The authors have declared that no competing interests exist.

Figures

Figure 1
Figure 1. Identify time period required for preparation from specification to differentiation during midgut development.
Left: the characteristic analysis at 29–40 pfh and 40–50 pfh. The characteristic equation (Table 1) shows when repressive effect of R and Otx together occurs; Right: 29–40 pfh(red bar) and 40–50 pfh (blue bar) are corresponding time periods in the control profile. Given that UI, R and Otx are activated at 29–40 pfh, only UI drives the state transition from 012 state: R and Otx are independent of the state transition. However, at 40–50 pfh (UI, R and Otx remain activated), the characteristic equation consists of the AND logic (ROtx)' which indicates that (ROtx)' is repressive: activation of R and Otx cooperatively prevent the state rises from 102 to 112 since (ROtx)' generates q0,t+1 = 0 when R = 1 and Otx = 1. Further analysis of Otx mutation (Table 3) shows R has no effect on any state transition suggesting that R is a silencer to Otx at 40–50 pfh (main text).
Figure 2
Figure 2. Overviews of SLM and analyses.
Step 1. Obtain temporal transcriptional activation and corresponding time-series expression data; Step 2. SLM Mapping: Dicretization and digitization into time-series bar chart; Step 3. Truth table construction: tabulate the digitized data into present states, input conditions and next states; Step 4. Mathematical mapping: Characteristic equation analysis and time simulation analysis; Step 5. Network motifs construction: integration of multiple SLMs to form gene network model.
Figure 3
Figure 3. Forward mapping and in silico mutagenesis of endo16 SLM.
(A) Discretized profile of BA-Bp·CAT at 0–50 and 61–72 pfh are reproduced by forward mapping. (B) In silico mutagenesis of R is achieved by providing input series with R is always set to 0. State transition to differentiation expression level occurred early at 40–50 pfh. The rest of the state transition beside 40–50 pfh is same as Figure 3(A). (C) In silico mutagenesis with Otx as the only input condition; the state transitions are generated to show similar expression profile to that of A-Bp·CAT ((Figure S1 (A))
Figure 4
Figure 4. Synthetic model for activation of E and A inputs.
(A) Only exhibits basal expression without binding of transcription factors. (B) Binding of transcriptional activator on activation site increase the expression level. (C) Binding of another activator on enhancer does not alter expression level. (D) Expression level is highly elevated in comparing to (B) when both activator site and enhancer are bound.
Figure 5
Figure 5. Construction of sequential logic mapping between dynamic transactivity and a state transition.
State (expression level) is represented by the two binary numbers, q1,t+1q0,t+1. (A) Activation of E and A inputs (E = 1, A = 1) generates the state transition from 012 to 102. The mapping between the activation of EA sites (Transcriptional activity) and the state transition (Gene expression)) is established by q1,t+1 = q1'q0EA and q1,t+1 = 0, where minterm (AND logic), q1'q0EA is 1 only if q1 = 0, q0 = 1, E = 1 and A = 1. (B) The mapping between input (E = 0, A = 1) and the state transition from 112 to 102 is established by q1,t+1 = q1q0E'A and q0,t+1 = 0, where minterm q1q0E'A is 1 only if q1 = 1, q0 = 1, E = 0 and A = 1.
Figure 6
Figure 6. Identification of dynamic functional activities of transcriptional inputs for EA model (
Eq. (3)). Function of identical transcription factor binding activity is not unique over time due to the dynamic nature. Left: characteristic equation analyses; Right: Colours (red and blue) indicate state transitions corresponding to the analyses. From Left, characteristic equation of the model at 012 present state indicates that while E and A sites are activated, E has no effect in the state transition from t3 to t4. The next state is generated by the characteristic equation q1,t+1 = A and q0,t+1 = 0, in which there is no E variable, i.e., E is independent of the state transition. The characteristic equation at 102 present state, q1,t+1 = E and q0,t+1 = EA shows that E is only functioning as enhancer at time t = t8 (see Right) when present state equals to 102 provided that A = 1. This example shows characteristic equation analysis can reveal when the enhancer function of E site occurs. (see conditional effect in Methods).
Figure 7
Figure 7. In silico mutagenesis: comparison of wild type and mutant expression profiles with 3 models.
(A) EA model shows E is an enhancer; (B) SEA model shows E is a synergistic enhancer and (C) CEA model reveals E is a synergistic enhancer as well as silencer. Figure 7 also shows when those effects of the E site occur. Wild type profiles: (A)–(C) are generated by Eq. (3), (4) and (5) with given input condition: EtAt = (102 002 012 112 102 002 012 112 112 012 002 002), where t = t0–t11. The corresponding mutant profiles are obtained by setting Et = 0 in input condition.
Figure 8
Figure 8. Construction of state map representation and reverse mapping of EA model.
(A) The state transition map (finite state machine), constructed using truth table (Table 5), consists of four states (purple circles), 10 state transitions (in arrow) and 16 input conditions (binary values associated to each arrow). (B) Using the state transition map in (a) the temporal binding activity corresponding digitized gene expression profile (002 012 102 102 112 112 112 112 002 002 002 002) is inferred (reverse mapping). There are 11 state transitions in 12 time steps. Following the 12 arrows in state transition map, there are 2 possible inputs (01, 11) for each of the first two transitions (002→012→102), 1 possible input for the next five transitions and 2 possible inputs for the final four transitions. In total, 64 possible combinations of input series are suggested where these input series are able to generate expression profile given by forward mapping.
Figure 9
Figure 9. Construction of gene network via SLMs: Synthetic network motifs.
(A)–(D) Four sets of SLMs that resemble four fundamental units are considered for construction of multiple gene network motifs (Table 9): EA/SEA models (positive regulation, set 1); Silencer-activator (SA)/Synergistic SA models (repressive regulation, set 2); By considering input condition of E site for set 1 as a function of its output state, an auto-regulative positive feedback is constructed; we denote this set as Simple positive feedback (set 3). Similarly, a silencer version of unit network motif for auto-regulative feedback, Simple negative feedback, is formed by considering input condition of S site for set 2 as a function of its output state (set 4). (E)–(I) To extend the single SLM approach to genes network, several combinations of two SLMs representing two genes, each regulated by two cis-acting sites are constructed based on the four set of fundamental units albeit with auto-regulative feedback replaced by inter-genetic feedback control (Table 9). In addition, all of these combinations are co-regulated networks with common activator site (A/A1). A co-regulated network is defined as set of genes that contained at least one common active cis-acting site. The simplest form of co-regulated network occurred when no direct connectivity found between two SLMs where Both Gene1 and Gene2 are linked by their common regulatory sites: E and A ((E)). Non-auto-regulative feedforward and feedback control can occur if Gene1 and Gene2 are connected by at least one of the gene product. Thus, in addition to intra-genetic-feedback control that happened in single SLM ((C)–(D)), network motifs constructed by multiple SLMs can exhibit inter-genetic-feedforward and feedback control. In inter-genetic-feedback control, the input condition of a SLM is now a function of output state from another SLM. Given that output signal from Gene2 is function as feedback signal onto Gene1, the input condition of Gene1, X1, is defined as a function of output state of Gene2: X1 = X1(q1,t+1,Gene2, q0,t+1, Gene2) where X1 can be either an enhancer or an silencer Gene1 ((H)–(I)). Inter-genetic-feedforward control is defined similarly to inter-feedback control where X2 = X2(q1,t+1,Gene1, q0,t+1, Gene1) since we consider output signal from Gene1 to be the feedforward signal onto Gene2 ((F)–(G)).

Similar articles

Cited by

References

    1. Bintu L, Buchler NE, Garcia HG, Gerland U, Hwa T, et al. Transcriptional regulation by the numbers: applications. Curr Opin Genet Dev. 2005;15:125–135. - PMC - PubMed
    1. Bintu L, Buchler NE, Garcia HG, Gerland U, Hwa T, et al. Transcriptional regulation by the numbers: models. Curr Opin Genet Dev. 2005;15:116–124. - PMC - PubMed
    1. Wolf DM, Eeckman FH. On the relationship between genomic regulatory element organization and gene regulatory dynamics. J Theor Biol. 1998;195:167–186. - PubMed
    1. Elowitz MB, Leibler S. A synthetic oscillatory network of transcriptional regulators. Nature. 2000;403:335–338. - PubMed
    1. Hasty J, McMillen D, Isaacs F, Collins JJ. Computational studies of gene regulatory networks: in numero molecular biology. Nat Rev Genet. 2001;2:268–279. - PubMed

Publication types

Substances

LinkOut - more resources