. 2007 Aug 22;2(8):e783.
doi: 10.1371/journal.pone.0000783.

Condensin I reveals new insights on mouse meiotic chromosome structure and dynamics

Affiliations

Condensin I reveals new insights on mouse meiotic chromosome structure and dynamics

Alberto Viera et al. PLoS One. .

Abstract

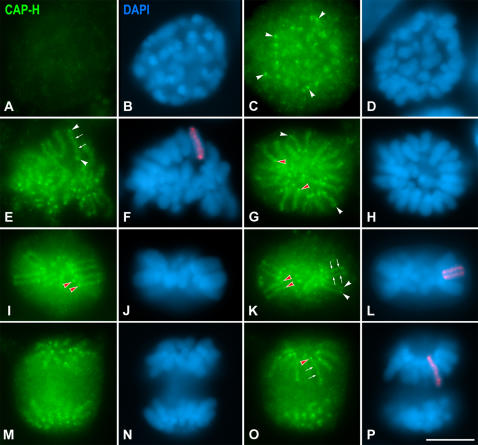
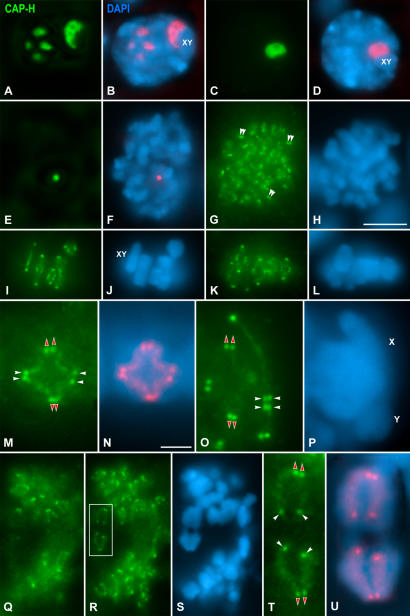
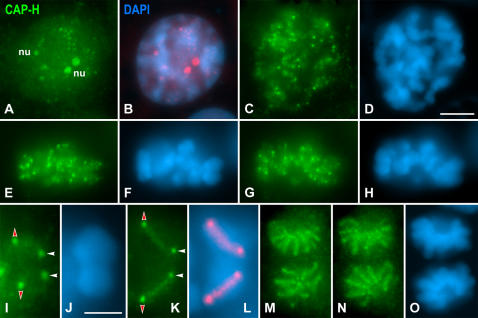
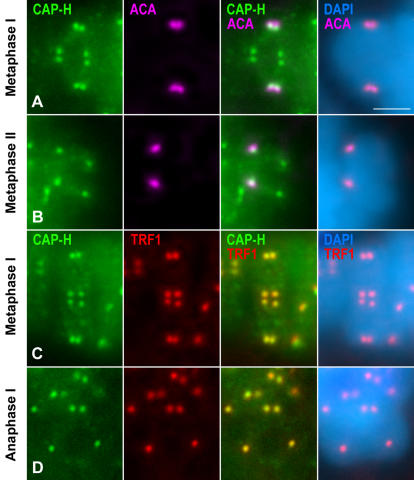
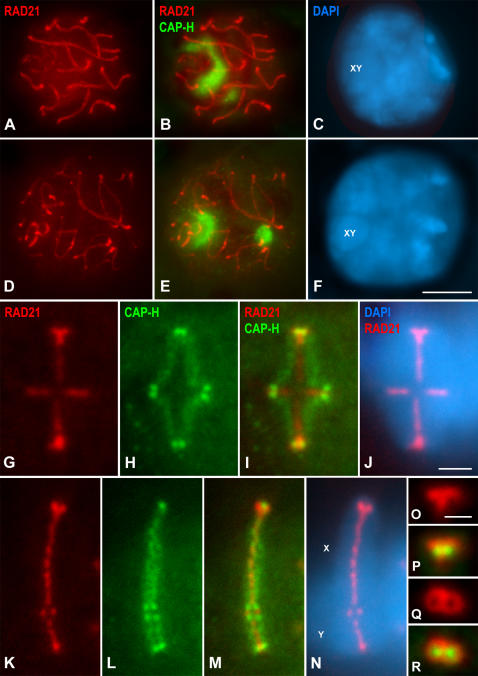
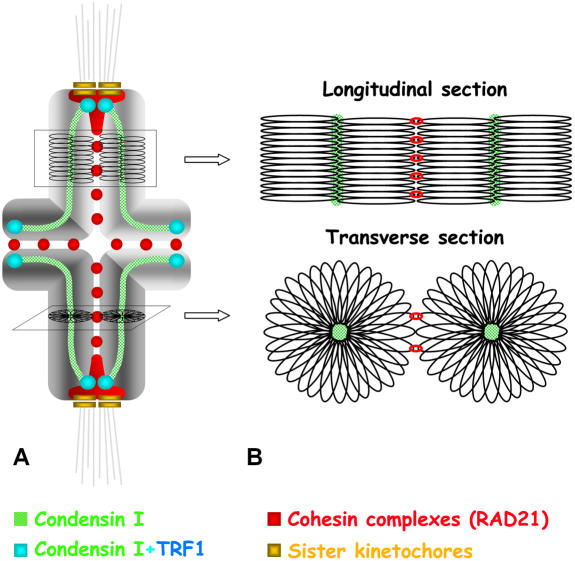
Chromosome shaping and individualization are necessary requisites to warrant the correct segregation of genomes in either mitotic or meiotic cell divisions. These processes are mainly prompted in vertebrates by three multiprotein complexes termed cohesin and condensin I and II. In the present study we have analyzed by immunostaining the appearance and subcellular distribution of condensin I in mouse mitotic and meiotic chromosomes. Our results demonstrate that in either mitotically or meiotically dividing cells, condensin I is loaded onto chromosomes by prometaphase. Condensin I is detectable as a fuzzy axial structure running inside chromatids of condensed chromosomes. The distribution of condensin I along the chromosome length is not uniform, since it preferentially accumulates close to the chromosome ends. Interestingly, these round accumulations found at the condensin I axes termini colocalized with telomere complexes. Additionally, we present the relative distribution of the condensin I and cohesin complexes in metaphase I bivalents. All these new data have allowed us to propose a comprehensive model for meiotic chromosome structure.


Conflict of interest statement

Competing Interests: The authors have declared that no competing interests exist.

Figures

Figure 1
Figure 1. CAP-H distribution in spermatogonial mitosis.
Mouse spermatogonia were stained for CAP-H (green) and counterstained with DAPI (blue). (A, B) CAP-H is not detected in early prophase. (C, D) In early prometaphase, condensing chromosomes show a faint and diffuse CAP-H labeling, but some bright accumulations (arrowheads) are observed on them. (E, F) In late prometaphase, CAP-H is detected as a single axis (arrows) running along and inside chromosomes. Note that the ends of these CAP-H axes (arrowheads) are brighter than the own axes. (G, H) Top view of a metaphase cell showing a ‘rosette’-like chromosome distribution. In these views a single CAP-H axis is seen in each chromosome. The centromeric (red arrowheads) and distal (white arrowheads) axes ends are brightly stained. (I–L) Lateral views of metaphase cells. In these views each chromosome shows two parallel CAP-H axes (arrows), one per sister chromatid. The centromeric (red arrowheads) and distal (white arrowheads) axes ends appear brightly stained. (M–P) Two different focal planes throughout an anaphase. A single CAP-H axis (arrows) is present inside each chromatid. In (F), (L) and (P) the CAP-H labeling on one chromosome/chromatid has been pseudocolored in red and superimposed on its corresponding DAPI image. Bar, 5 µm.
Figure 2
Figure 2. CAP-H distribution in meiosis I spermatocytes.
Mouse spermatocytes were stained for CAP-H (green) and counterstained with DAPI (blue). (A, B) In pachytene spermatocytes, CAP-H is detected in nucleoli lying in the nucleoplasm and associated to the sex body (XY). (C, D) Diplotene spermatocytes exhibit a CAP-H accumulation in the nucleolus associated to the sex body (XY). (E, F) In diakinesis, CAP-H is detected in a nucleolar remnant in the nucleoplasm. (G, H) In prometaphase I spermatocytes, a faint CAP-H labeling is observed along bivalents, and pairs of bright dots (double arrowheads) at chromosome ends. (I–L) Two focal planes throughout a metaphase I spermatocyte. The autosomal and sex (XY) bivalents show pairs of bright CAP-H spots at their centromeric and distal ends. (M–P) Selected autosomal and sex (XY) metaphase I bivalents. Four pairs of bright CAP-H spots are detected in each bivalent, one pair at each centromeric chromosome end (red arrowheads), and one pair at each distal chromosome end (white arrowheads). In (M) a diffuse CAP-H axis is observed inside each chromatid between the proximal and distal spots. (Q-S) Two focal planes of an anaphase I spermatocyte. (T, U) Segregating half-bivalents boxed in (R). In each chromosome, a pair of CAP-H dots is detected at the centromere region (red arrowheads), one spot at the distal end of each chromatid (white arrowheads), and a diffuse axial labeling along chromatids. In (B), (D), (F), (N) and (U) the CAP-H staining has been pseudocolored in red and superimposed on its corresponding DAPI image. Bars: (A–L, Q–S) 5 µm; (M–P, T and U) 3 µm.
Figure 3
Figure 3. CAP-H distribution in meiosis II spermatocytes.
Mouse spermatocytes were stained for CAP-H (green) and counterstained with DAPI (blue). (A, B) Late interkinesis nucleus. CAP-H appears at several nucleoli (nu) and as small spots in the nucleoplasm. (C, D) Prophase II spermatocyte. A diffuse CAP-H labeling, and bright spots, are observed along chromosomes. (E–H) Two different focal planes of a metaphase II spermatocyte. Bright CAP-H spots are present at chromosome ends. (I, J) Selected metaphase II chromosome. Each chromatid shows two CAP-H spots, one at the centromeric end (red arrowheads) and one at its distal end (white arrowhead). (K, L) Selected segregating chromatids in early anaphase II. Both chromatids present a CAP-H axis and one spot at each axis end. (M–O) Two focal planes of a late anaphase II spermatocyte. Each chromatid exhibits a single diffuse CAP-H axis between the centromeric and distal ends spots. In (B) and (L) the CAP-H labeling has been pseudocolored in red and superimposed on its corresponding DAPI image. Bars: (A–H, M–O) 5 µm; (I–L) 3 µm.
Figure 4
Figure 4. CAP-H accumulates preferentially at telomere complexes.
Selected bivalents and chromosomes were stained for CAP-H (green), kinetochores revealed by an ACA serum (pink), TRF1 (red), and counterstained with DAPI (blue). (A) Metaphase I bivalent. A pair of CAP-H dots at the centromere region of each chromosome is below the closely associated sister kinetochores. (B) Metaphase II chromosome. The separated CAP-H spots at the centromere region appear below the kinetochores. (C) Metaphase I bivalent and (D) anaphase I half-bivalent. The CAP-H dots colocalize with the TRF1 signals. Bar, 3 µm.
Figure 5
Figure 5. Distribution of CAP-H and the cohesin subunit RAD21 in meiotic chromosomes.
Mouse spermatocytes were stained for RAD21 (red), CAP-H (green) and counterstained with DAPI (blue). (A-C) Pachytene spermatocyte. RAD21 is located on the autosomal lateral elements and unsynapsed sex (XY) axial elements, while CAP-H concentrates at nucleoli. (D-F) Diplotene. RAD21 appears on either the desynapsed autosomal lateral elements, or the unsynapsed sex (XY) axial elements, and CAP-H remains associated to nucleoli. (G-J) Selected metaphase I autosomal bivalent. RAD21 appears enriched at homologous centromeres, conforming a T-shaped structure, and as a series of fainter patches at the interchromatid domain. Note that the RAD21 labeling is interrupted at the interstitial chiasma. By contrast, the CAP-H labeling is found as diffuse axes along the inner region of each chromatid, and as brighter spots at the centromeric and distal axes ends. (K-N) Selected metaphase I sex bivalent. The labeling patterns of RAD21 and CAP-H in sex bivalents resemble those found on autosomes, except for a larger and more continuous RAD21 labeling at the interchromatid domain. (O, P) Enlarged side view of a metaphase I centromere. RAD21 appears as a T-shaped structure, and the CAP-H spots partially colocalize with the middle region of the RAD21 signal. (Q, R) Enlarged top view of a metaphase I centromere. RAD21 appears as two associated rings that surround the CAP-H spots. Bars: (A–F) 5 µm; (G–N) 3 µm; (O–R) 1.5 µm.
Figure 6
Figure 6. Representation of a metaphase I bivalent showing the relative distributions of condensin I and RAD21-containing cohesin complexes.
One chromosome is depicted in light grey and its homologue is darker grey. Chromosomes are telocentric, and the metaphase I bivalent shows a single interstitial chiasma. Kinetochores are indicated in yellow, kMTs in light grey, condensin I in green, RAD21 in red, and TRF1 in blue. The colocalisation of condensin I and TRF1 is shown in light blue. In (A), the condensin I complexes delineate a fuzzy axis inside each chromatid, with prominent accumulations at their proximal and distal ends which colocalize with TRF1. The two proximal condensin I accumulations appear below the closely associated sister kinetochores, and partially colocalize with the middle region of the T-shaped RAD21 structure at each centromere. RAD21-containing cohesin complexes are also depicted as patches at the interchromatid domain. (B) Hypothetical model accounting for the distribution of condensin I and RAD21-containing cohesin complexes in relation to radial chromatin loops in a mouse metaphase I bivalent. The longitudinal and transverse sections of the arms correspond to areas indicated in (A).

Similar articles

Cited by

References

    1. Swedlow JR, Hirano T. The making of the mitotic chromosome: modern insights into classical questions. Mol Cell. 2003;11:557–69. - PubMed
    1. Hirano T. Condensins: organizing and segregating the genome. Curr Biol. 2005;15:R265–75. - PubMed
    1. Belmont AS. Mitotic chromosome structure and condensation. Curr Opin Cell Biol. 2006;18:632–8. - PubMed
    1. Losada A, Hirano T. Dynamic molecular linkers of the genome: the first decade of SMC proteins. Genes Dev. 2005;19:1269–87. - PubMed
    1. Nasmyth K, Haering CH. The structure and function of SMC and kleisin complexes. Annu Rev Biochem. 2005;74:595–648. - PubMed

Publication types

MeSH terms