

Genes at human chromosome 5q31.1 regulate delayed-type hypersensitivity responses associated with Leishmania chagasi infection
- PMID: 17713557
- PMCID: PMC2435172
- DOI: 10.1038/sj.gene.6364422
Genes at human chromosome 5q31.1 regulate delayed-type hypersensitivity responses associated with Leishmania chagasi infection
Abstract
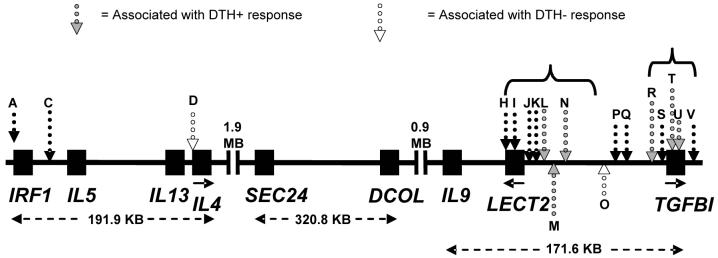
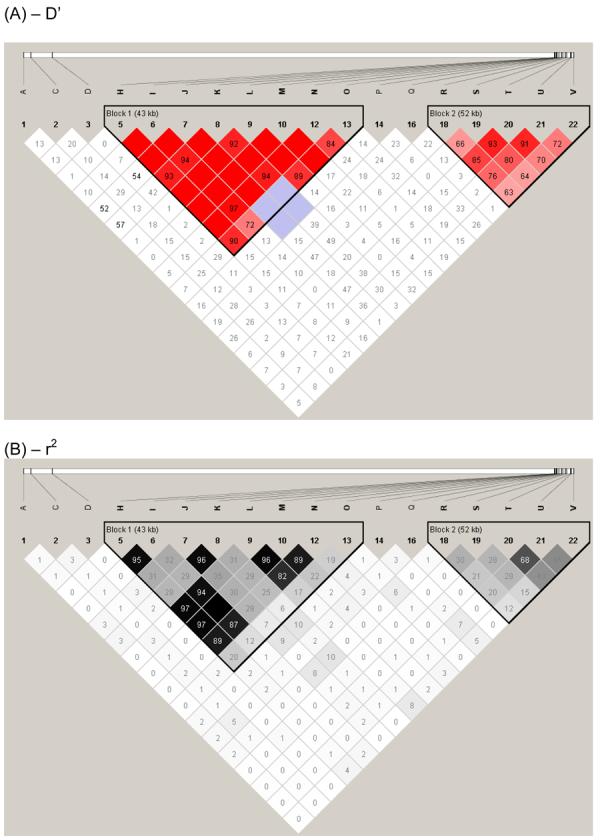
Visceral leishmaniasis (VL) caused by Leishmania chagasi is endemic to northeast Brazil. A positive delayed-type hypersensitivity skin test response (DTH+) is a marker for acquired resistance to disease, clusters in families and may be genetically controlled. Twenty-three single nucleotide polymorphisms (SNPs) were genotyped in the cytokine 5q23.3-q31.1 region IRF1-IL5-IL13-IL4-IL9-LECT2-TGFBI in 102 families (323 DTH+; 190 DTH-; 123 VL individuals) from a VL endemic region in northeast Brazil. Data from 20 SNPs were analyzed for association with DTH+/- status and VL using family-based, stepwise conditional logistic regression analysis. Independent associations were observed between the DTH+ phenotype and markers in separate linkage disequilibrium blocks in LECT2 (OR 2.25; P=0.005; 95% CI=1.28-3.97) and TGFBI (OR 1.94; P=0.003; 95% CI=1.24-3.03). VL child/parent trios gave no evidence of association, but the DTH- phenotype was associated with SNP rs2070874 at IL4 (OR 3.14; P=0.006; 95% CI=1.38-7.14), and SNP rs30740 between LECT2 and TGFBI (OR 3.00; P=0.042; 95% CI=1.04-8.65). These results indicate several genes in the immune response gene cluster at 5q23.3-q31.1 influence outcomes of L. chagasi infection in this region of Brazil.
Figures
Similar articles
-
Association between the tumor necrosis factor locus and the clinical outcome of Leishmania chagasi infection.Infect Immun. 2002 Dec;70(12):6919-25. doi: 10.1128/IAI.70.12.6919-6925.2002. Infect Immun. 2002. PMID: 12438370 Free PMC article.
-
Comprehensive candidate gene analysis for symptomatic or asymptomatic outcomes of Leishmania infantum infection in Brazil.Ann Hum Genet. 2017 Jan;81(1):41-48. doi: 10.1111/ahg.12180. Epub 2017 Jan 4. Ann Hum Genet. 2017. PMID: 28054334 Free PMC article.
-
Fine mapping under linkage peaks for symptomatic or asymptomatic outcomes of Leishmania infantum infection in Brazil.Infect Genet Evol. 2016 Sep;43:1-5. doi: 10.1016/j.meegid.2016.05.005. Epub 2016 May 4. Infect Genet Evol. 2016. PMID: 27155051 Free PMC article.
-
Immunogenetics of leishmanial and mycobacterial infections: the Belem Family Study.Philos Trans R Soc Lond B Biol Sci. 1997 Sep 29;352(1359):1331-45. doi: 10.1098/rstb.1997.0118. Philos Trans R Soc Lond B Biol Sci. 1997. PMID: 9355125 Free PMC article. Review.
-
Genetics and visceral leishmaniasis: of mice and man.Parasite Immunol. 2009 May;31(5):254-66. doi: 10.1111/j.1365-3024.2009.01102.x. Parasite Immunol. 2009. PMID: 19388946 Free PMC article. Review.
Cited by
-
Genetic control of canine leishmaniasis: genome-wide association study and genomic selection analysis.PLoS One. 2012;7(4):e35349. doi: 10.1371/journal.pone.0035349. Epub 2012 Apr 25. PLoS One. 2012. PMID: 22558142 Free PMC article.
-
Gene Signatures of Symptomatic and Asymptomatic Clinical-Immunological Profiles of Human Infection by Leishmania (L.) chagasi in Amazonian Brazil.Microorganisms. 2023 Mar 3;11(3):653. doi: 10.3390/microorganisms11030653. Microorganisms. 2023. PMID: 36985226 Free PMC article.
-
Leishmania donovani Nucleoside Hydrolase (NH36) Domains Induce T-Cell Cytokine Responses in Human Visceral Leishmaniasis.Front Immunol. 2017 Mar 7;8:227. doi: 10.3389/fimmu.2017.00227. eCollection 2017. Front Immunol. 2017. PMID: 28321221 Free PMC article.
-
Urine as a promising sample for Leishmania DNA extraction in the diagnosis of visceral leishmaniasis - a review.Braz J Infect Dis. 2019 Mar-Apr;23(2):111-120. doi: 10.1016/j.bjid.2019.04.001. Epub 2019 May 1. Braz J Infect Dis. 2019. PMID: 31054271 Free PMC article. Review.
-
New record of preclinical diagnosis of American visceral leishmaniasis in Amazonian Brazil encourages optimizing disease control.Parasite Epidemiol Control. 2020 May 8;10:e00154. doi: 10.1016/j.parepi.2020.e00154. eCollection 2020 Aug. Parasite Epidemiol Control. 2020. PMID: 32435706 Free PMC article.
References
-
- Wilson ME, Jeronimo SM, Pearson RD. Immunopathogenesis of infection with the visceralizing Leishmania species. Microb Pathog. 2005;38:147–160. - PubMed
-
- Pearson RD, Sousa AQ. Clinical spectrum of Leishmaniasis. Clin Infect Dis. 1996;22:1–13. - PubMed
-
- Sundar S, Rosenkaimer F, Murray HW. Successful treatment of refractory visceral leishmaniasis in India using antimony plus interferon-gamma. J Infect Dis. 1994;170:659–662. - PubMed
-
- Jeronimo SM, Teixeira MJ, Sousa A, Thielking P, Pearson RD, Evans TG. Natural history of Leishmania (Leishmania) chagasi infection in Northeastern Brazil: long-term follow-up. Clin Infect Dis. 2000;30:608–609. - PubMed
-
- Costa CH, Stewart JM, Gomes RB, Garcez LM, Ramos PK, Bozza M, et al. Asymptomatic human carriers of Leishmania chagasi. Am J Trop Med Hyg. 2002;66:334–337. - PubMed
Publication types
MeSH terms
Grants and funding
LinkOut - more resources
Full Text Sources
Miscellaneous
