. 2007 Sep;5(9):e223.
doi: 10.1371/journal.pbio.0050223.

Conserving biodiversity efficiently: what to do, where, and when

Affiliations

Conserving biodiversity efficiently: what to do, where, and when

Kerrie A Wilson et al. PLoS Biol. 2007 Sep.

Abstract

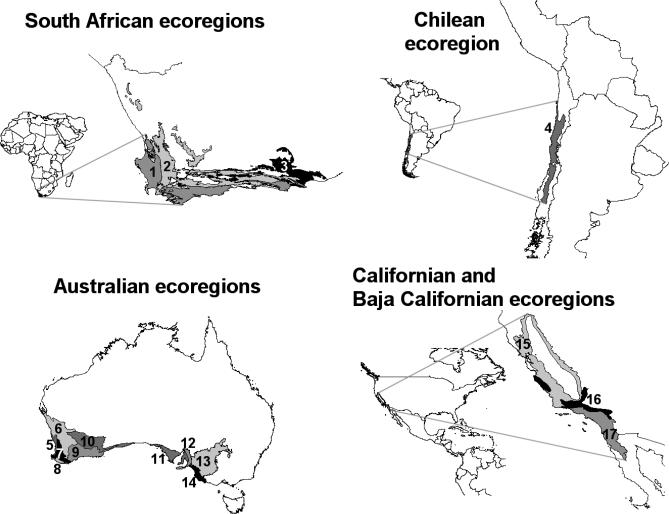
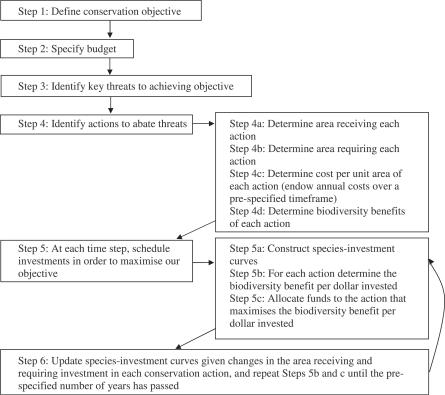
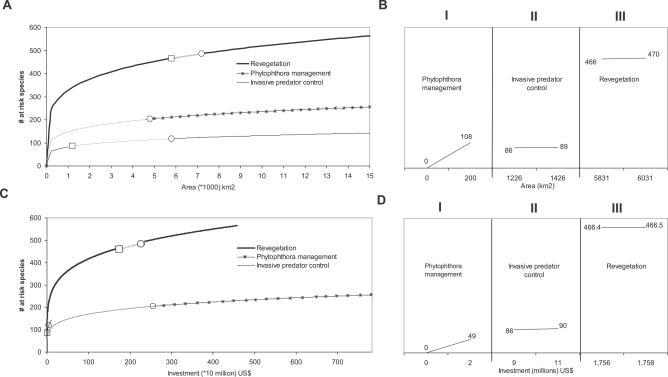
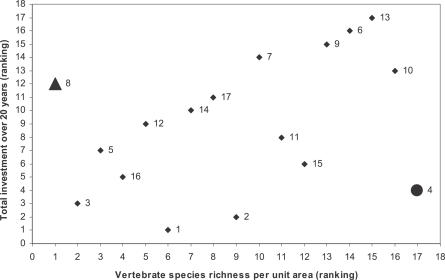
Conservation priority-setting schemes have not yet combined geographic priorities with a framework that can guide the allocation of funds among alternate conservation actions that address specific threats. We develop such a framework, and apply it to 17 of the world's 39 Mediterranean ecoregions. This framework offers an improvement over approaches that only focus on land purchase or species richness and do not account for threats. We discover that one could protect many more plant and vertebrate species by investing in a sequence of conservation actions targeted towards specific threats, such as invasive species control, land acquisition, and off-reserve management, than by relying solely on acquiring land for protected areas. Applying this new framework will ensure investment in actions that provide the most cost-effective outcomes for biodiversity conservation. This will help to minimise the misallocation of scarce conservation resources.


Conflict of interest statement

Competing interests. The authors have declared that no competing interests exist.

Figures

Figure 1
Figure 1. The Mediterranean Ecoregions of South Africa, Chile, Australia, and California/Baja California
Lowland fynbos and renosterveld (1), montane fynbos and renosterveld (2), Albany thickets (3), Chilean matorral (4), Swan Coastal Plain scrub and woodlands (5), Southwest Australia savanna (6), Southwest Australia woodlands (7), Jarrah-Karri forest and shrublands (8), Esperance mallee (9), Coolgardie woodlands (10), Eyre and York mallee (11), Mount Lofty woodlands (12), Murray-Darling woodlands and mallee (13), Naracoorte woodlands (14), interior chaparral and woodlands (15), montane chaparral and woodlands (16), and coastal sage scrub and chaparral (17).
Figure 2
Figure 2. Decision Steps Involved in the Conservation Investment Framework
Figure 3
Figure 3. Species–Area Curves and Species–Investment Curves for Three Conservation Actions
The three actions portrayed are Phytophthora management, invasive predator control, and revegetation in the Swan Coastal Plain scrub and woodlands ecoregion of Australia. In (A) and (C), the area of conservation interest is illustrated by the curve to the left of the circles, comprising the area already receiving the action (denoted by the solid lines between the origin and the squares) and the area requiring the action (denoted by the dashed lines between the squares and the circles). Three categories of species are represented within the tail of the curves, beyond the area of conservation interest (that is, to the right of the circles). The species within these categories are not necessarily mutually exclusive. The first contains at risk species whose populations also occur in habitat outside the area of conservation interest for a particular threat. These species do not rely fully on the conservation action to persist in the ecoregion. The second category also reflects the uncertainty about the distributions of species, as these species do not actually occur within the area of conservation interest. The third category represents part of the extinction debt due to past habitat loss and contains at risk species that are unlikely to persist in the ecoregion over the long term, regardless of the conservation action. The number of species in each of the three groups cannot be determined in this example, since our method of estimating biodiversity benefit does not allow the individual species or their geographic distributions to be identified (Text S2). (A) Species–area curves. (B) The number of at risk species protected after an additional investment of 200 km2 in each conservation action (the panels are close-ups of the curves in [A] and represent the benefit of the additional investment from the area already receiving the action). (C) Species–investment curves, where the area invested in each action is replaced by the cost of the ecoaction. (D) The number of at risk species protected before and after an additional investment of US$2 million in each conservation action (the panels are close-ups of the curves in [C] and represent the benefit of the additional investment in the area already receiving the action).
Figure 4
Figure 4. Scatter Plot of the Ecoregion Priorities When Ranked According to Total Investment and Vertebrate Species Richness
Ecoregion codes are those provided in Figure 1, and vertebrate richness is represented by the richness of vertebrates per unit area (based on the total area of each ecoregion). Discrepancy between rankings is marked. The Chilean matorral ecoregion (denoted by a circle) has low species richness per unit area, but received a relatively large funding allocation over 20 y. The Jarrah-Karri forest and shrublands ecoregion (denoted by a triangle) has the greatest vertebrate species richness per unit area, but received a relatively small funding allocation over 20 y.

Similar articles

Cited by

References

    1. Brooks TM, Mittermeier RA, Fonseca GABd, Gerlach J, Hoffmann M, et al. Global biodiversity conservation priorities. Science. 2006;313:58–61. - PubMed
    1. Redford KH, Coppolillo P, Sanderson EW, da Fonseca GAB, Dinerstein E, et al. Mapping the conservation landscape. Conserv Biol. 2003;17:116–131.
    1. Hoekstra JM, Boucher TM, Ricketts TH, Roberts C. Confronting a biome crisis: Global disparities of habitat loss and protection. Ecol Lett. 2005;8:23–29.
    1. Wilson KA, McBride MF, Bode M, Possingham HP. Prioritising global conservation efforts. Nature. 2006;440:337–340. - PubMed
    1. Costello C, Polasky S. Dynamic reserve site selection. Resour Energy Econ. 2004;26:157–174.

Publication types