Review
. 2007 Aug;17(4):423-9.
doi: 10.1016/j.conb.2007.07.001. Epub 2007 Aug 21.

Sensory adaptation

Affiliations
Review

Sensory adaptation

Barry Wark et al. Curr Opin Neurobiol. 2007 Aug.

Abstract

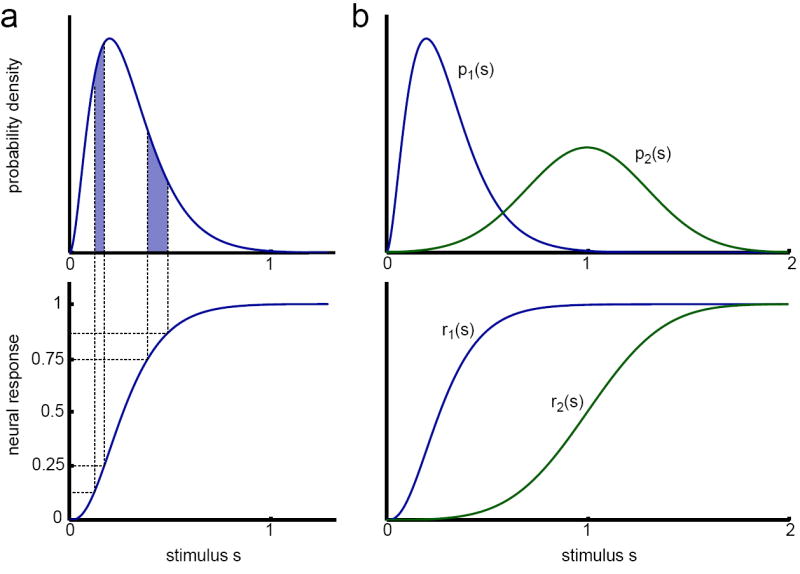
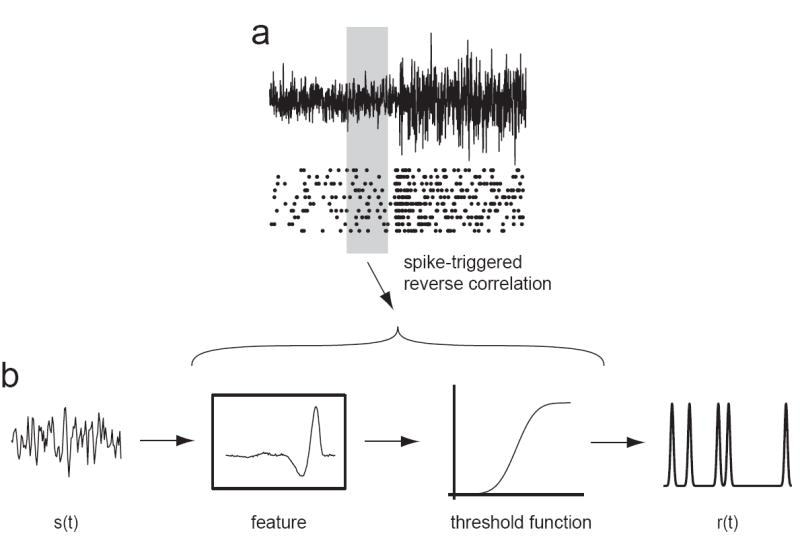
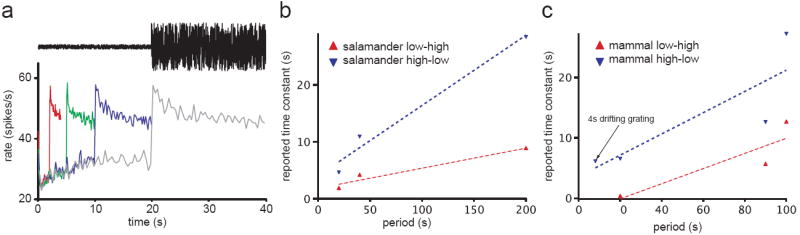
Adaptation occurs in a variety of forms in all sensory systems, motivating the question: what is its purpose? A productive approach has been to hypothesize that adaptation helps neural systems to efficiently encode stimuli whose statistics vary in time. To encode efficiently, a neural system must change its coding strategy, or computation, as the distribution of stimuli changes. Information theoretic methods allow this efficient coding hypothesis to be tested quantitatively. Empirically, adaptive processes occur over a wide range of timescales. On short timescales, underlying mechanisms include the contribution of intrinsic nonlinearities. Over longer timescales, adaptation is often power-law-like, implying the coexistence of multiple timescales in a single adaptive process. Models demonstrate that this can result from mechanisms within a single neuron.


Figures

Figure 1
Figure 1. An example of efficient coding
(a) Given a stimulus distribution (top), and a fixed output range, the maximally efficient mapping from stimulus to response is the integral of the stimulus distribution (bottom), known as the cumulative distribution. This mapping transforms equal probability in the stimulus distribution (shaded areas) to equal response ranges, making all responses equally likely. (b) When the stimulus distribution changes, for example from p1 to p2 (top), the maximally efficient mapping also changes. The new mapping, r2(s), is the cumulative distribution of p2(s). In this case, both the mean and the variance of the stimulus distribution change, leading to a shift in the half-maximum and a decrease in gain (slope) of r2(s) compared to r1(s), respectively.
Figure 2
Figure 2. Neuronal computation modeled using a linear/nonlinear (LN) model
The linear filter(s) and nonlinear threshold function of the model are estimated by using reverse correlation between spikes and stimuli. (a) The spike times of a neuron are recorded in response to some stimulus. In this example, a filtered Gaussian white noise stimulus is presented, where the variance of the stimulus changes periodically between two values, but the white noise is generated anew in each variance cycle. A raster plot of spike times produced in response to several different instantiations of the white noise process are shown below. The stimulus preceding each spike is used to find the feature(s) and threshold function of the LN model by reverse correlation. (b) Computation is then modeled by linearly filtering incoming stimuli with the previously determined feature(s). Filtered stimuli are then passed through the threshold function, which gives the probability of firing an action potential as a function of time. To examine how the LN model changes with the variance context, spikes are sampled from a particular time bin with respect to the changes in the variance (shaded box) to compute time-dependent features and threshold functions.
Figure 3
Figure 3. The apparent timescale of adaptation depends on the dynamics of changes in the stimulus ensemble
(a) In this example of a switching experiment, the variance of a Gaussian white noise stimulus is changed periodically between two values (top). Following an increase in stimulus variance, the average firing rate of a motion sensitive H1 cell in the fly visual system (bottom) increased transiently and then relaxed towards a baseline (gray trace). As the period of switches in stimulus variance was increased, the time constant of the slow relaxation in firing rate increased proportionally from 5s period (red trace) to 40s period (gray trace). (b) The reported time constant of slow relaxation in firing rate [9] or input currents [13] of RGCs or input currents to bipolar cells [60] following an increase (red) or decrease (blue) in contrast of a full field flickering stimulus increases with increasing switching period. Where Rieke [60] reports a sum of exponentials, we have plotted the time constant of the best fitting single exponential. In this and (c), dashed lines are linear regression fits. (c) The reported time constant of slow relaxation in firing rate of rabbit RGCs [9,34] or the firing rate [16] or input currents [35] of guinea pig RGCs following an increase (red) or decrease (blue) in contrast of a full field flickering stimulus increases with increasing switching period. An arrow identifies the exceptional stimulus [35] in which a non-periodic 4s sinusoid grating was presented instead of a flickering field. Where Brown et al. [34] report time to 66% recovery, we plot the time constant of an exponential with equal time to 66% recovery. The results of (b-c) are expected if the observed systems modify their rate of gain change according to stimulus history, and are consistent with power law, not exponential, dynamics.

Similar articles

Cited by

References

    1. Simoncelli EP. Vision and the statistics of the visual environment. Curr Opin Neurobiol. 2003;13:144–149. - PubMed
    1. Barlow HB. Possible principles underlying the transformation of sensory messages. In: Rosenblith W, editor. Sensory Communication. MIT Press; 1961.
    1. Laughlin SB. The role of sensory adaptation in the retina. J Exp Biol. 1989;146:39–62. - PubMed
    1. Ulanovsky N, Las L, Nelken I. Processing of low-probability sounds by cortical neurons. Nat Neurosci. 2003;6:391–398. - PubMed
    1. Ulanovsky N, Las L, Farkas D, Nelken I. Multiple time scales of adaptation in auditory cortex neurons. J Neurosci. 2004;24:10440–10453. - PMC - PubMed

Publication types