. 2007;35(17):5717-28.
doi: 10.1093/nar/gkm588. Epub 2007 Aug 22.

Novel high-resolution characterization of ancient DNA reveals C > U-type base modification events as the sole cause of post mortem miscoding lesions

Affiliations

Novel high-resolution characterization of ancient DNA reveals C > U-type base modification events as the sole cause of post mortem miscoding lesions

Paul Brotherton et al. Nucleic Acids Res. 2007.

Abstract

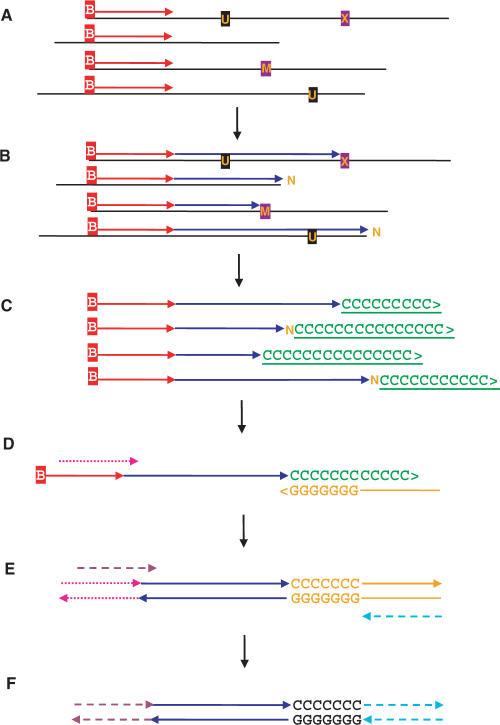
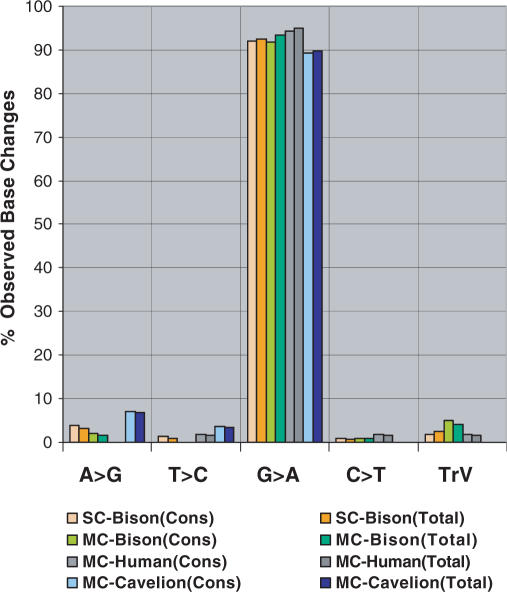
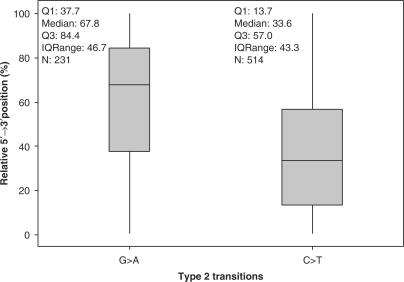
Ancient DNA (aDNA) research has long depended on the power of PCR to amplify trace amounts of surviving genetic material from preserved specimens. While PCR permits specific loci to be targeted and amplified, in many ways it can be intrinsically unsuited to damaged and degraded aDNA templates. PCR amplification of aDNA can produce highly-skewed distributions with significant contributions from miscoding lesion damage and non-authentic sequence artefacts. As traditional PCR-based approaches have been unable to fully resolve the molecular nature of aDNA damage over many years, we have developed a novel single primer extension (SPEX)-based approach to generate more accurate sequence information. SPEX targets selected template strands at defined loci and can generate a quantifiable redundancy of coverage; providing new insights into the molecular nature of aDNA damage and fragmentation. SPEX sequence data reveals inherent limitations in both traditional and metagenomic PCR-based approaches to aDNA, which can make current damage analyses and correct genotyping of ancient specimens problematic. In contrast to previous aDNA studies, SPEX provides strong quantitative evidence that C > U-type base modifications are the sole cause of authentic endogenous damage-derived miscoding lesions. This new approach could allow ancient specimens to be genotyped with unprecedented accuracy.


Figures

Figure 1.
Figure 1.
Single primer extension (SPEX) amplification. (A) Denaturation and hybridization of a single biotinylated primer to one target strand at the locus-of-interest. (B) Primer extension by a thermostable DNA polymerase until halted at the physical end of an aDNA template molecule; at a polymerase-blocking modified base [M]; or at an abasic site, some other non-coding lesion, or some kind of physical block [X]. Miscoding lesions [U] do not block primer extension, but result in altered sequences. Polymerases can catalyze the non-directed addition of a single 3′-terminal nucleotide [N] following primer extension to either the physical end of a fragmented aDNA template, or to an abasic site or other non-coding lesion. Single or multiple cycles of SPEX primer extension can be used. Biotinylated molecules were then bound to Streptavidin-coated beads and stringent washes removed everything else (e.g. aDNA template molecules, enzymes, buffer, etc). (C) Biotinylated primers and extended primers (with single-stranded, direct first-generation copies of individual aDNA template molecules) were then polyC-tailed using terminal transferase (TdT), followed again by bead-wash removal of TdT and buffer. (D) Locus-specific, primer-extended, polyC-tailed ssDNA molecules were then selectively amplified by PCR; using a partially-nested, locus-specific, SPEX-2 forward primer (Tables S1 and S2) and a polyG-based, 5′ adapter-tagged, reverse primer (Tables S1 and S2). (E) These products were amplified a final time by PCR using a further partially nested, locus-specific, SPEX-3 forward primer (Tables S1 and S2) and a 5′-adapter reverse primer (Tables S1 and S2). (F) The final products of SPEX amplification underwent restriction digestion, directional cloning and sequencing.
Figure 2.
Figure 2.
Graph showing the percentage of clones of the single-cycle SPEX CDS and TCDS (Figure S1; Table 1) versus ‘template amplifiable size’ (in bp) by PCR. The best-fit function that describes the data is an exponential decay (ExpGauss) with formula y = exp(a+b*x+c*x2); where: a = 3.966; b = 0.019 and c = 0.050. The best-fit line was obtained by non-linear least-square curve fitting algorithms, and the curve shows the relationship between SPEX-amplified aDNA product length (x) and the percentage of all clones for each product length (y). Template amplifiable mean: 83.5 bp and SD: 24.9 bp. The minimum size considered was 47 bp, which corresponds to SPEX primer extension events that originally extended 1 base past the 3′-end of the final SPEX-3 partially nested forward PCR primer (Tables S1 and S2).
Figure 3.
Figure 3.
The percentage of the total observed base changes corresponding to each different transition and all transversions (grouped) following the single- or multi-cycle SPEX amplification of various ancient extracts. SC = Single-cycle SPEX. MC = Multi-cycle SPEX. Cons = CDS. Total = TCDS. TrV = transversions. SC-Bison = 6 ancient bison extracts: (Cons) 7,654 bp, 337 discrete sequences; (Total) 10,644 bp, 548 independent amplicons. MC-Bison = 5 ancient bison extracts: (Cons) 4,187 bp, 171 discrete sequences; (Total) 4,934 bp, 219 independent amplicons. MC-Human = 4 ancient human extracts (at 3 loci): (Cons) 3304 nucleotides, 164 discrete sequences; (Total) 4,647 bp, 271 independent amplicons. MC-Cavelion = 3 ancient Eurasian cave lion extracts: (Cons) 4,086 bp, 111 discrete sequences; (Total) 4,470 bp, 141 independent amplicons.
Figure 4.
Figure 4.
Box-plot showing the 5′ to 3′ distribution of Type 2 (C > T/G > A) transitions following the PCR amplification of 454-generated ssDNA molecules (514 C > T and 231 G > A). The plot comprises a box and whiskers. A line is drawn across the box to represent the median; the bottom of the box is the first quartile (Q1) and the top is the third quartile (Q3). The lower whisker extends to the lowest value within the lower limit, whilst the upper whisker extends to the highest value within the upper limit. The limits are defined by: Q1 − 1.5(Q3 − Q1) (lower limit) and Q3 + 1.5(Q3 − Q1) (upper limit). The exact position of each type of damage was normalized to allow comparison between molecules of different lengths where 0% corresponds to the 5′-terminal base and 100% the 3′-terminal base. The horizontal line represents the median of the relative position of the damage and the box represents the middle 50% (the inter-quartile) of the relative position of each type of damage from all ssDNA molecules combined.

References

    1. Endicott P, Gilbert MT, Stringer C, Lalueza-Fox C, Willerslev E, Hansen AJ, Cooper A. The genetic origins of the Andaman Islanders. Am. J. Hum. Genet. 2003;72:178–184. - PMC - PubMed
    1. Haak W, Forster P, Bramanti B, Matsumura S, Brandt G, Tanzer M, Villems R, Renfrew C, Gronenborn D, et al. Ancient DNA from the first European farmers in 7500-year-old Neolithic sites. Science. 2005;310:1016–1018. - PubMed
    1. Ritchie PA, Millar CD, Gibb GC, Baroni C, Lambert DM. Ancient DNA enables timing of the pleistocene origin and holocene expansion of two adelie penguin lineages in antarctica. Mol. Biol. Evol. 2004;21:240–248. - PubMed
    1. Shapiro B, Drummond AJ, Rambaut A, Wilson MC, Matheus PE, Sher AV, Pybus OG, Gilbert MT, Barnes I, et al. Rise and fall of the Beringian steppe bison. Science. 2004;306:1561–1565. - PubMed
    1. Pääbo S. Ancient DNA: extraction, characterization, molecular cloning and enzymatic amplification. Proc. Natl Acad. Sci. USA. 1989;86:1939–1943. - PMC - PubMed

Publication types