

Regulatory T-cell markers, indoleamine 2,3-dioxygenase, and virus levels in spleen and gut during progressive simian immunodeficiency virus infection
- PMID: 17715231
- PMCID: PMC2168803
- DOI: 10.1128/JVI.00760-07
Regulatory T-cell markers, indoleamine 2,3-dioxygenase, and virus levels in spleen and gut during progressive simian immunodeficiency virus infection
Abstract
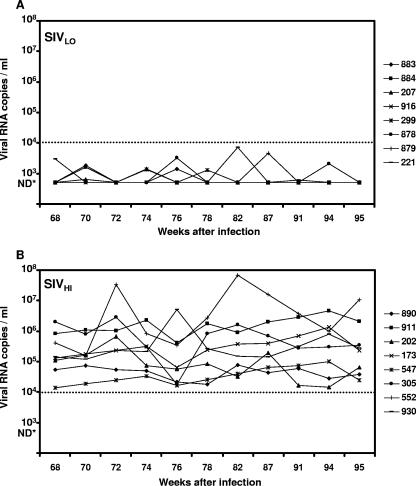
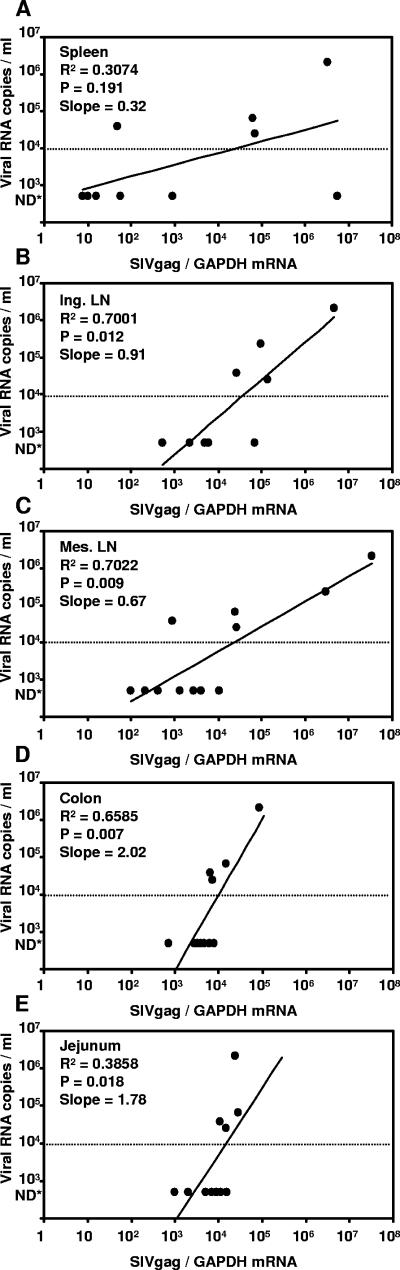
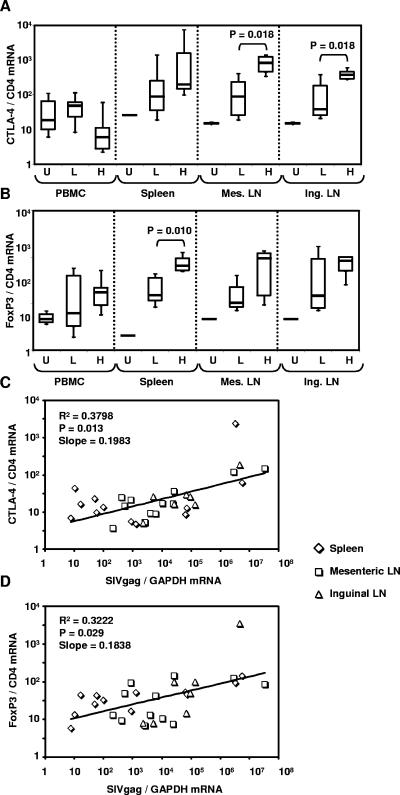
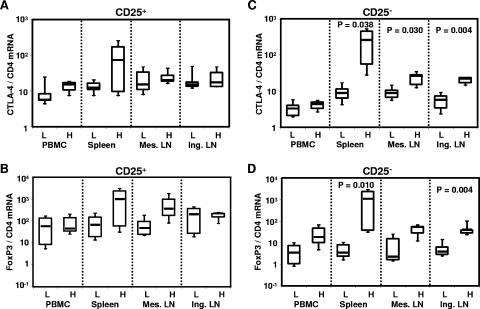
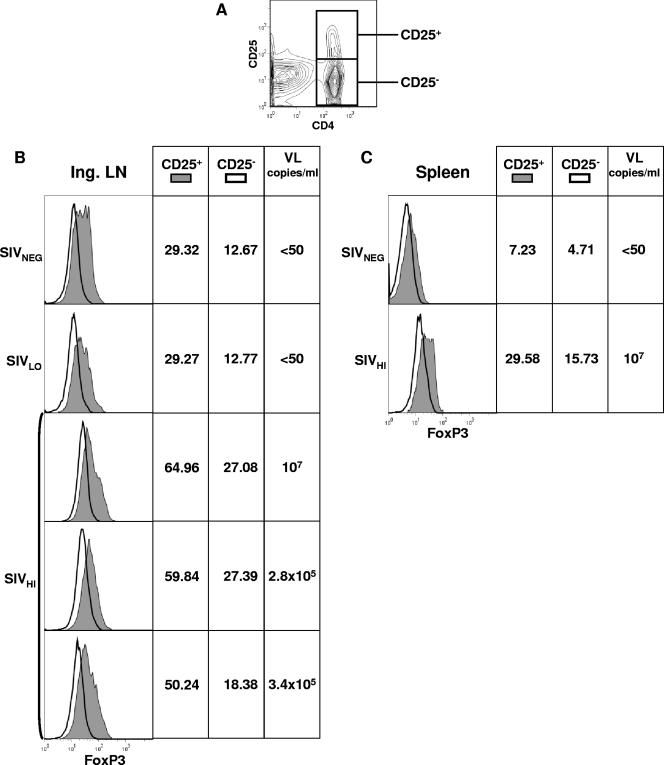
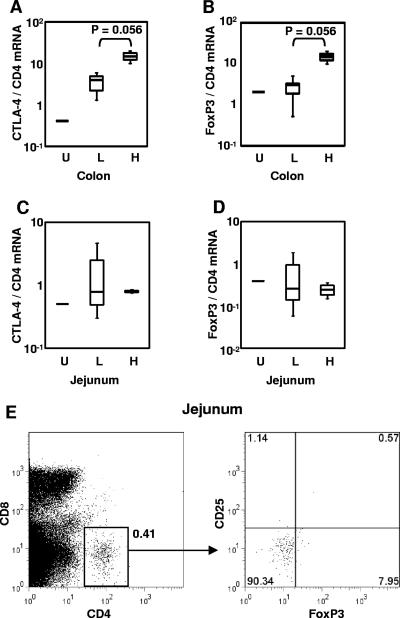
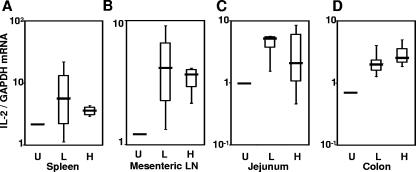
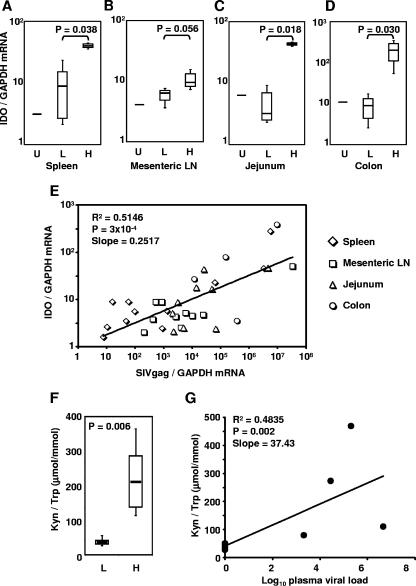
High levels of viral replication occur in gut-associated lymphoid tissue (GALT) and other lymphoid tissues (LT) since the early phase of human/simian immunodeficiency virus (HIV/SIV) infection. Regulatory T cells (T(reg)), a subset of immunosuppressive T cells expressing CTLA-4 and the FoxP3 transcription factor, accumulate in LT during HIV/SIV infection. Here we show that FoxP3 and CTLA-4 mRNA are increased in leukocytes from the spleens, lymph nodes (LN), and mucosal sites of chronically SIV-infected macaques with high viremia (SIV(HI)) compared to animals with low viremia (SIV(LO)). FoxP3 and CTLA-4 correlated with SIV RNA levels in tissues; SIV virus levels in the spleen, inguinal LN, mesenteric LN, colon, and jejunum directly correlated with the plasma virus level. Importantly, CTLA-4 and FoxP3 mRNA were predominantly increased in the CD25(-) subpopulation of leukocytes from SIV(HI), further challenging the classical definition of T(reg) as CD4(+) CD25(+) T cells. Similar to CTLA-4 and FoxP3, expression of indoleamine 2,3-dioxygenase (IDO), an immunosuppressive enzyme induced by T(reg) in antigen-presenting cells, was increased in the spleens, mesenteric LN, colons, and jejuna from SIV(HI) compared to SIV(LO) and directly correlated to SIV RNA in the same tissues. Accordingly, plasma kynurenine/tryptophan, a marker for IDO enzymatic activity, was significantly higher in SIV(HI) compared to SIV(LO) and correlated with plasma viral levels. Increased T(reg) and IDO in LT of SIV-infected macaques may be the consequence of increased tissue inflammation and/or may favor virus replication during the chronic phase of SIV infection.
Figures
Similar articles
-
CTLA-4 blockade decreases TGF-beta, IDO, and viral RNA expression in tissues of SIVmac251-infected macaques.Blood. 2006 Dec 1;108(12):3834-42. doi: 10.1182/blood-2006-04-010637. Epub 2006 Aug 8. Blood. 2006. PMID: 16896154 Free PMC article.
-
FoxP3+ CD25+ CD8+ T-cell induction during primary simian immunodeficiency virus infection in cynomolgus macaques correlates with low CD4+ T-cell activation and high viral load.J Virol. 2007 Dec;81(24):13444-55. doi: 10.1128/JVI.01466-07. Epub 2007 Sep 26. J Virol. 2007. PMID: 17898053 Free PMC article.
-
Expansion of FOXP3+ CD8 T cells with suppressive potential in colorectal mucosa following a pathogenic simian immunodeficiency virus infection correlates with diminished antiviral T cell response and viral control.J Immunol. 2010 Feb 15;184(4):1690-701. doi: 10.4049/jimmunol.0902955. Epub 2010 Jan 6. J Immunol. 2010. PMID: 20053943
-
Using an ancient tool for igniting and propagating immune tolerance: IDO as an inducer and amplifier of regulatory T cell functions.Curr Med Chem. 2011;18(15):2215-21. doi: 10.2174/092986711795656027. Curr Med Chem. 2011. PMID: 21517758 Review.
-
Targeting indoleamine 2,3-dioxygenase (IDO) to counteract tumour-induced immune dysfunction: from biochemistry to clinical development.Endocr Metab Immune Disord Drug Targets. 2009 Jun;9(2):151-77. doi: 10.2174/187153009788452453. Endocr Metab Immune Disord Drug Targets. 2009. PMID: 19519465 Review.
Cited by
-
A dendrite in every pie: myeloid dendritic cells in HIV and SIV infection.Virulence. 2012 Nov 15;3(7):647-53. doi: 10.4161/viru.22491. Epub 2012 Nov 15. Virulence. 2012. PMID: 23154284 Free PMC article. Review.
-
Positive and negative regulation of cellular immune responses in physiologic conditions and diseases.Clin Dev Immunol. 2012;2012:485781. doi: 10.1155/2012/485781. Epub 2012 Mar 26. Clin Dev Immunol. 2012. PMID: 22548114 Free PMC article. Review.
-
Attenuation of pathogenic immune responses during infection with human and simian immunodeficiency virus (HIV/SIV) by the tetracycline derivative minocycline.PLoS One. 2014 Apr 14;9(4):e94375. doi: 10.1371/journal.pone.0094375. eCollection 2014. PLoS One. 2014. PMID: 24732038 Free PMC article.
-
Anti-tat Hutat2:Fc mediated protection against tat-induced neurotoxicity and HIV-1 replication in human monocyte-derived macrophages.J Neuroinflammation. 2014 Nov 22;11:195. doi: 10.1186/s12974-014-0195-2. J Neuroinflammation. 2014. PMID: 25416164 Free PMC article.
-
Generalized immune activation as a direct result of activated CD4+ T cell killing.J Biol. 2009;8(10):93. doi: 10.1186/jbiol194. J Biol. 2009. PMID: 19943952 Free PMC article.
References
-
- Andersson, J., A. Boasso, J. Nilsson, R. Zhang, N. J. Shire, S. Lindback, G. M. Shearer, and C. A. Chougnet. 2005. The prevalence of regulatory T cells in lymphoid tissue is correlated with viral load in HIV-infected patients. J. Immunol. 174:3143-3147. - PubMed
-
- Bernard, N. F., D. N. Chernoff, and C. M. Tsoukas. 1998. Effect of splenectomy on T-cell subsets and plasma HIV viral titers in HIV-infected patients. J. Hum. Virol. 1:338-345. - PubMed
-
- Birebent, B., R. Lorho, H. Lechartier, S. de Guibert, M. Alizadeh, N. Vu, A. Beauplet, N. Robillard, and G. Semana. 2004. Suppressive properties of human CD4+ CD25+ regulatory T cells are dependent on CTLA-4 expression. Eur. J. Immunol. 34:3485-3496. - PubMed
Publication types
MeSH terms
Substances
Grants and funding
LinkOut - more resources
Full Text Sources
Other Literature Sources
Research Materials
