

Rhythms and alternating patterns in plants as emergent properties of a model of interaction between development and functioning
- PMID: 17715304
- PMCID: PMC2710268
- DOI: 10.1093/aob/mcm171
Rhythms and alternating patterns in plants as emergent properties of a model of interaction between development and functioning
Abstract
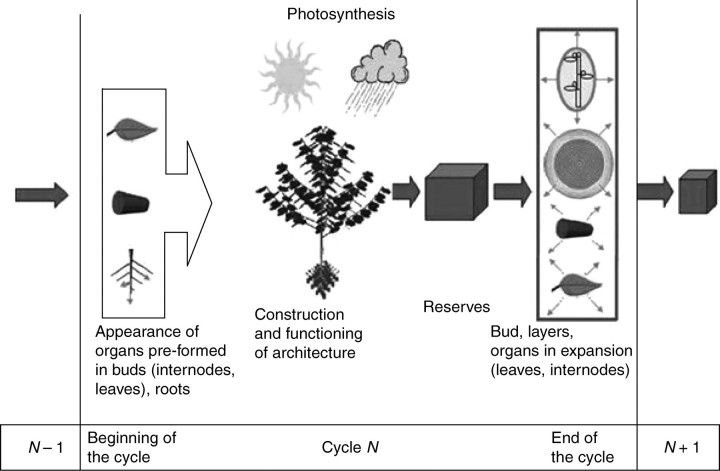
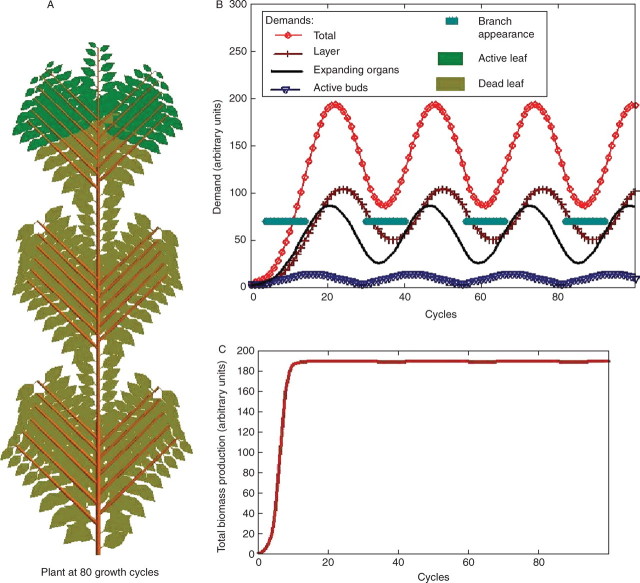
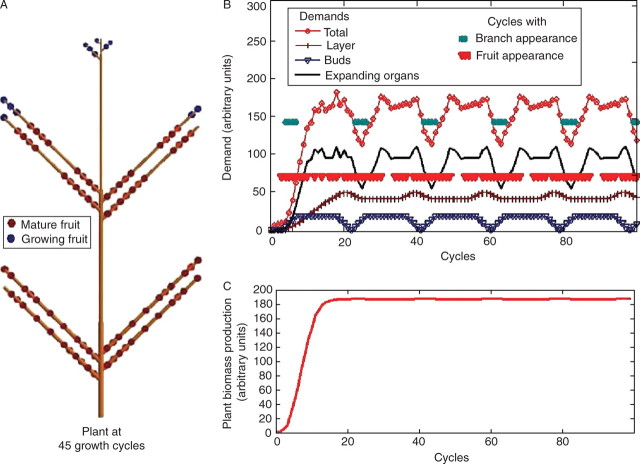
Background and aims: To model plasticity of plants in their environment, a new version of the functional-structural model GREENLAB has been developed with full interactions between architecture and functioning. Emergent properties of this model were revealed by simulations, in particular the automatic generation of rhythms in plant development. Such behaviour can be observed in natural phenomena such as the appearance of fruit (cucumber or capsicum plants, for example) or branch formation in trees.
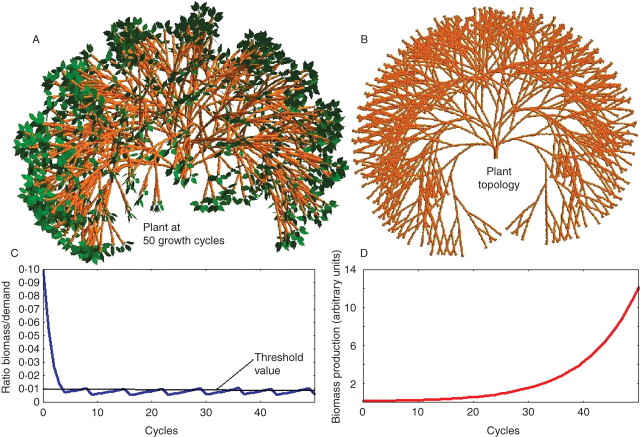
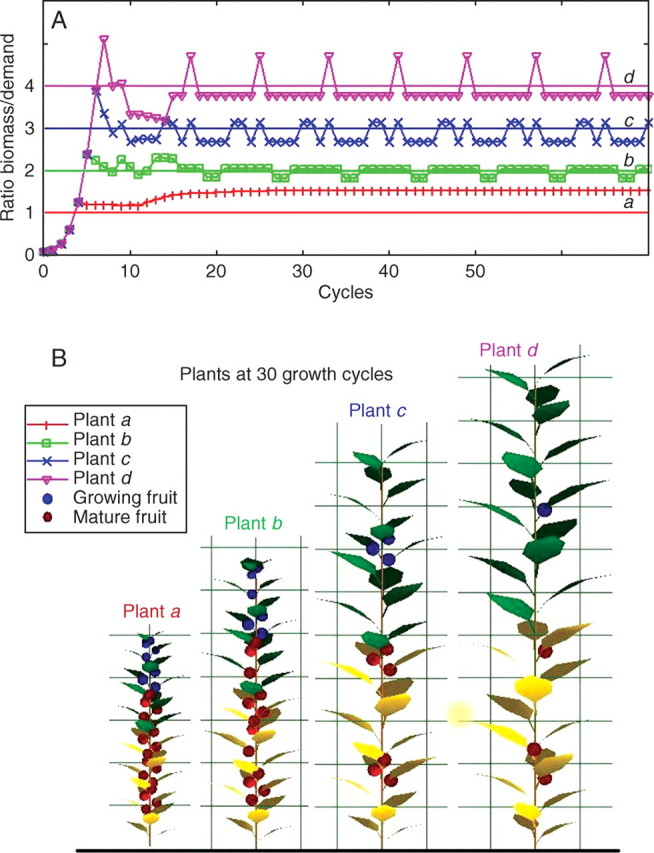
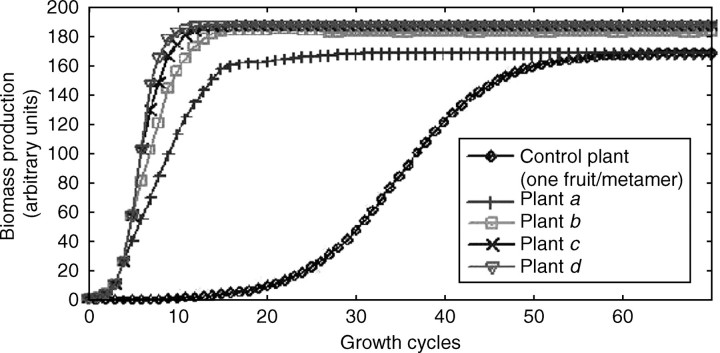
Methods: In the model, a single variable, the source-sink ratio controls different events in plant architecture. In particular, the number of fruits and branch formation are determined as increasing functions of this ratio. For some sets of well-chosen parameters of the model, the dynamical evolution of the ratio during plant growth generates rhythms.
Key results and conclusions: Cyclic patterns in branch formation or fruit appearance emerge without being forced by the model. The model is based on the theory of discrete dynamical systems. The mathematical formalism helps us to explain rhythm generation and to control the behaviour of the system. Rhythms can appear during both the exponential and stabilized phases of growth, but the causes are different as shown by an analytical study of the system. Simulated plant behaviours are very close to those observed on real plants. With a small number of parameters, the model gives very interesting results from a qualitative point of view. It will soon be subjected to experimental data to estimate the model parameters.
Figures
Similar articles
-
Dry matter partitioning models for the simulation of individual fruit growth in greenhouse cucumber canopies.Ann Bot. 2011 Oct;108(6):1075-84. doi: 10.1093/aob/mcr150. Epub 2011 Jun 28. Ann Bot. 2011. PMID: 21715366 Free PMC article.
-
Simulation of fruit-set and trophic competition and optimization of yield advantages in six Capsicum cultivars using functional-structural plant modelling.Ann Bot. 2011 Apr;107(5):793-803. doi: 10.1093/aob/mcq223. Epub 2010 Nov 22. Ann Bot. 2011. PMID: 21097946 Free PMC article.
-
Correlation between dynamic tomato fruit-set and source-sink ratio: a common relationship for different plant densities and seasons?Ann Bot. 2011 Apr;107(5):805-15. doi: 10.1093/aob/mcq244. Epub 2010 Dec 23. Ann Bot. 2011. PMID: 21183453 Free PMC article.
-
Two decades of research with the GreenLab model in agronomy.Ann Bot. 2021 Feb 9;127(3):281-295. doi: 10.1093/aob/mcaa172. Ann Bot. 2021. PMID: 32969464 Free PMC article. Review.
-
Theoretical models for branch formation in plants.J Plant Res. 2019 May;132(3):325-333. doi: 10.1007/s10265-019-01107-9. Epub 2019 Apr 19. J Plant Res. 2019. PMID: 31004242 Free PMC article. Review.
Cited by
-
Plant growth modelling and applications: the increasing importance of plant architecture in growth models.Ann Bot. 2008 May;101(8):1053-63. doi: 10.1093/aob/mcn050. Epub 2008 Apr 3. Ann Bot. 2008. PMID: 18387970 Free PMC article.
-
Characterization of the interactions between architecture and source-sink relationships in winter oilseed rape (Brassica napus) using the GreenLab model.Ann Bot. 2011 Apr;107(5):765-79. doi: 10.1093/aob/mcq205. Epub 2010 Oct 27. Ann Bot. 2011. PMID: 20980324 Free PMC article.
-
A functional-structural kiwifruit vine model integrating architecture, carbon dynamics and effects of the environment.Ann Bot. 2011 Apr;107(5):747-64. doi: 10.1093/aob/mcq180. Epub 2010 Sep 20. Ann Bot. 2011. PMID: 20855486 Free PMC article.
-
Dry matter partitioning models for the simulation of individual fruit growth in greenhouse cucumber canopies.Ann Bot. 2011 Oct;108(6):1075-84. doi: 10.1093/aob/mcr150. Epub 2011 Jun 28. Ann Bot. 2011. PMID: 21715366 Free PMC article.
-
Stochastic modelling of tree architecture and biomass allocation: application to teak (Tectona grandis L. f.), a tree species with polycyclic growth and leaf neoformation.Ann Bot. 2018 Jun 8;121(7):1397-1410. doi: 10.1093/aob/mcy040. Ann Bot. 2018. PMID: 29596559 Free PMC article.
References
-
- Balandier P, Lacointe A, Le Roux X, Sinoquet H, Cruziat P, Le Dizès S. Simwal: a structural-functional model simulating single walnut tree growth in response to climate and pruning. Annals of Forest Science. 2000;57:571–585.
-
- Barthélémy D. Levels of organization and repetition phenomena in seed plants. Acta Biotheoretica. 1991;39:309–323.
-
- Barthélémy D, Caraglio Y, Costes E. Architecture, gradients morphogénétiques et âge physiologique chez les végétaux. In: Bouchon J, de Reffye P, Barthélémy D, editors. Modélisation et simulation de l'architecture des végétaux. Paris: INRA Editions; 1997. pp. 89–136. Sciences Updates.
-
- Blaise F, Barczi J, Jaeger M, Dinouard P, de Reffye P. Simulation of the growth of plants. Modeling of metamorphosis and spatial interactions in the architecture and development of plants. In: Kuni TL, Luciani A, editors. Cyberworlds. Tokyo: Springer Verlag; 1998. pp. 81–109.
