. 2007 Dec 1;110(12):3871-80.
doi: 10.1182/blood-2007-03-082065. Epub 2007 Aug 22.

Novel role for EKLF in megakaryocyte lineage commitment

Affiliations

Novel role for EKLF in megakaryocyte lineage commitment

Pilar Frontelo et al. Blood. .

Abstract

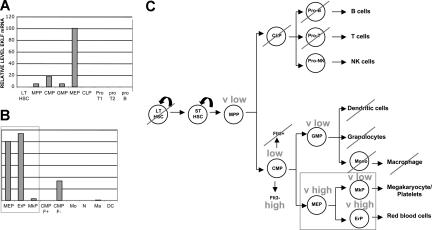
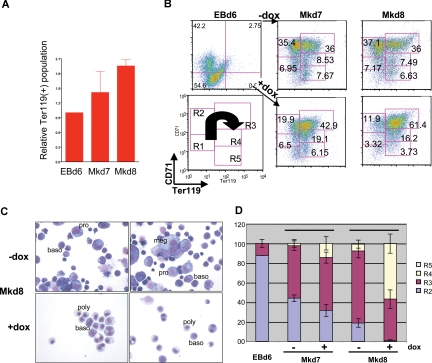
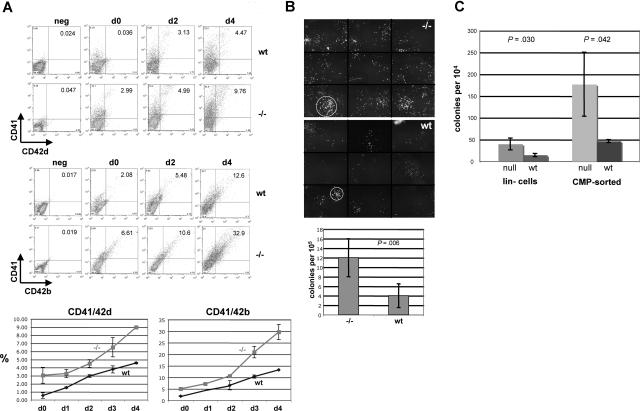
Megakaryocytes and erythroid cells are thought to derive from a common progenitor during hematopoietic differentiation. Although a number of transcriptional regulators are important for this process, they do not explain the bipotential result. We now show by gain- and loss-of-function studies that erythroid Krüppel-like factor (EKLF), a transcription factor whose role in erythroid gene regulation is well established, plays an unexpected directive role in the megakaryocyte lineage. EKLF inhibits the formation of megakaryocytes while at the same time stimulating erythroid differentiation. Quantitative examination of expression during hematopoiesis shows that, unlike genes whose presence is required for establishment of both lineages, EKLF is uniquely down-regulated in megakaryocytes after formation of the megakaryocyte-erythroid progenitor. Expression profiling and molecular analyses support these observations and suggest that megakaryocytic inhibition is achieved, at least in part, by EKLF repression of Fli-1 message levels.


Figures

Figure 1
Figure 1
EKLF expression during hematopoietic cell differentiation. Cell populations were sorted as detailed in Table S1 and monitored for EKLF expression by quantitative RT-PCR. Two experiments are shown (A,B) and the results summarized (C; pathway based on Weissman et al). Each sample was monitored in triplicate; values were normalized in each experiment to the EKLF level in megakaryocyte/erythroid progenitors (MEPs) which was set to 100. LT-HSC indicates long-term hematopoietic stem cell; MPP, multipotent progenitor; CMP, common myeloid/erythroid progenitor; GMP, granulocyte/macrophage progenitor; MEP, megakaryocyte/erythroid progenitor; CLP, common lymphoid progenitor; ProT1 and ProT2, T-cell progenitor; proB, B-cell progenitor; EP, erythroid progenitor; MkP, megakaryocyte progenitor; CMP F+, myeloid and B-cell progenitor; CMP F−, myeloid/erythroid progenitor; Mo, monocytes; N, neutrophile granulocytes; Ma, bone marrow derived macrophages; DC, dendritic cells.
Figure 2
Figure 2
EKLF induction negatively affects megakaryocyte formation during embryoid body (EB) differentiation. (A) Doxycycline treatment of a stable embryonic stem (ES) cell line that contains single-copy, integrated tetO-EKLF-GFP results in robust expression of GFP and EKLF within 24 hours. GFP was monitored by FACS, EKLF was monitored by anti-FLAG Western blot analysis of extracts. Representative results are shown. (B) EKLF was induced in differentiating EBs by treatment with doxycycline at day 4 and harvested at day 8. Representative FACS analyses are shown for hematopoietic progenitor (c-Kit), progenitor/megakaryocyte (CD41), and megakaryocyte (CD42b) markers. All gates were drawn based on negative controls for each sample (not shown). The table (percentages) is a subset of a more extensive analysis summarized as Table S2.
Figure 3
Figure 3
Megakaryocyte markers are inhibited during EB differentiation on OP9 cells after EKLF induction. (A) CD41 and CD42d expression was monitored by FACS in day 6 EBs or at 24 (Mkd7), 48 (Mkd8), or 72 hours (Mkd9) after placement on OP9 cells with thrombopoietin (TPO) with or without doxycycline. (B) All gates were drawn based on negative controls for each sample (not shown). Numbers within the FACS indicate the percentage of CD42d+ cells in each population. Data in panel A are presented as the ratio of induced to uninduced CD42d+ levels from 7 independent experiments after subtracting negative controls for each sample using the Overton cumulative histogram subtraction algorithm (thus the pretreated EBd6 ratio is one). Error bars are SD.
Figure 4
Figure 4
EKLF induction affects erythroid differentiation. FACS (A,B) and morphologic (C,D) assessment of cells derived from day 6 EBs or at 24 (Mkd7) or 48 (Mkd8) hours after placement on OP9 cells with thrombopoietin (TPO) with or without doxycycline. Data in panel A ares presented as the ratio of induced to uninduced Ter119+ levels from 4 independent experiments after subtracting negative controls for each sample using the Overton cumulative histogram subtraction algorithm (thus the pretreated EBd6 ratio is one). Representative FACS data of CD71 and Ter119 in panel B are boxed according to R1-R5 categories of progressive erythroid maturation as described in Zhang et al and schematized in the lower left panel, with the arrow showing the FACS pattern for differentiation as it proceeds from least to most mature. Numbers in each box indicate the percentage of cells within each category. Proerythroblasts (pro), basophilic erythroblasts (baso), polychromatophilic erythroblasts (poly), and megakaryocytes (meg) are indicated in panel C (May-Grunwald/giemsa stain). The frequency of megakaryocytic cells in the Mkd8 samples (C,D) was 29% (± 6%) in the absence of induction compared with 7% (± 1%) in the induced sample based on counts from 2 fields of 100 cells each from 2 independent experiments. Morphologic criteria for R2-R5 (D) were as described. Error bars in panels A and D are SD.
Figure 5
Figure 5
EKLF-null fetal liver cells yield a greater expansion of megakaryocytes. (A) E13.5 fetal liver cells from wild-type (wt) or EKLF-null (−/−) embryos were monitored for levels of CD41, CD42b, and CD42d as indicated before (d0) or after (d1-4) incubation in TPO. A representative FACS is shown (top) along with a graph of 3 additional experiments. Values are shown for double-positive cells. All gates were drawn based on negative controls for each sample (not shown). Fetal liver cell numbers are within 10% between wild-type and null embryos. Numbers on plots are numbers of cells in that rectangle. (B) E13.5 fetal liver cells were monitored for megakaryocyte colony formation in MegaCult slides. Colony formation was visualized by Alexa 288–labeled 1B5 antibody. Typical colonies are shown on top, which is a composite of 9 different areas (separated by horizontal and vertical lines) that covers approximately 56% of the slide; circles demarcate the typical difference in wild-type (wt) versus EKLF-null (−/−) colony size. Below is a graph of data from 5 experiments. (C) E13.5 fetal liver cells from wild-type (wt) or EKLF-null (null) were lineage-depleted (lin) or CMP-sorted and monitored for megakaryocyte colony formation. The graph is an average of 3 experiments. Error bars represent SD. P-values are from t-tests.
Figure 6
Figure 6
Expression of selected genes after EKLF induction during EB differentiation. Day 6 EBs (EBd6) were untreated (−) or treated (+) with doxycycline for 24 (Mkd7) or 48 (Mkd8) hours during growth on OP9 cells in TPO as in Figure 3. Total RNA was isolated from each, and the same sample was monitored for expression of EKLF, Fli-1, and β maj (A) or GATA1, GATA2, and RUNX1 (B). Expression normalized to levels of GAPDH is graphed; all analyses were performed in triplicate, and panel A was from 2 independent experiments. Error bars represent SD.
Figure 7
Figure 7
EKLF, Fli1, and GATA1 expression during MEP differentiation and repression of Fli1 by EKLF. Cell populations were sorted as detailed in Table S1 and monitored for EKLF, Fli1, and GATA1 expression by quantitative RT-PCR. Each sample was monitored in triplicate; values were normalized to the expression level in MEPs which was set to 100. (A) Relative levels are directly compared between EKLF and Fli1 (top) or EKLF and GATA1 (bottom). (B) Summary of the common and divergent expression patterns during bipotential differentiation from the MEP. Abbreviations are as in Table S1. (C) K562 cells were cotransfected with the pFli1 + i-Luc reporter plasmid and the indicated amounts (in μg) of Fli1 and EKLF expression plasmids. The graph displays the effects of increasing quantities of transfected EKLF plasmid on the reporter luciferase activity after normalization for transfection efficiency. Levels are expressed relative to that seen with reporter alone (given a value of 1). In the panel below, nuclear cell extracts from the transfected cells were tested for the presence of Fli1 or EKLF protein by Western blotting. Error bars represent SD.

References

    1. Orkin SH. Diversification of haematopoietic stem cells to specific lineages. Nat Rev Genet. 2000;1:57–64. - PubMed
    1. Weissman IL, Anderson DJ, Gage F. Stem and progenitor cells: origins, phenotypes, lineage commitments, and transdifferentiations. Annu Rev Cell Dev Biol. 2001;17:387–403. - PubMed
    1. Kondo M, Wagers AJ, Manz MG, et al. Biology of hematopoietic stem cells and progenitors: implications for clinical application. Annu Rev Immunol. 2003;21:759–806. - PubMed
    1. Traver D, Miyamoto T, Christensen J, Iwasaki-Arai J, Akashi K, Weissman IL. Fetal liver myelopoiesis occurs through distinct, prospectively isolatable progenitor subsets. Blood. 2001;98:627–635. - PubMed
    1. Adolfsson J, Mansson R, Buza-Vidas N, et al. Identification of Flt3+ lympho-myeloid stem cells lacking erythro-megakaryocytic potential a revised road map for adult blood lineage commitment. Cell. 2005;121:295–306. - PubMed

Publication types

MeSH terms

Substances