. 2007;11(4):R90.
doi: 10.1186/cc6102.

Burn size determines the inflammatory and hypermetabolic response

Affiliations

Burn size determines the inflammatory and hypermetabolic response

Marc G Jeschke et al. Crit Care. 2007.

Abstract

Background: Increased burn size leads to increased mortality of burned patients. Whether mortality is due to inflammation, hypermetabolism or other pathophysiologic contributing factors is not entirely determined. The purpose of the present study was to determine in a large prospective clinical trial whether different burn sizes are associated with differences in inflammation, body composition, protein synthesis, or organ function.

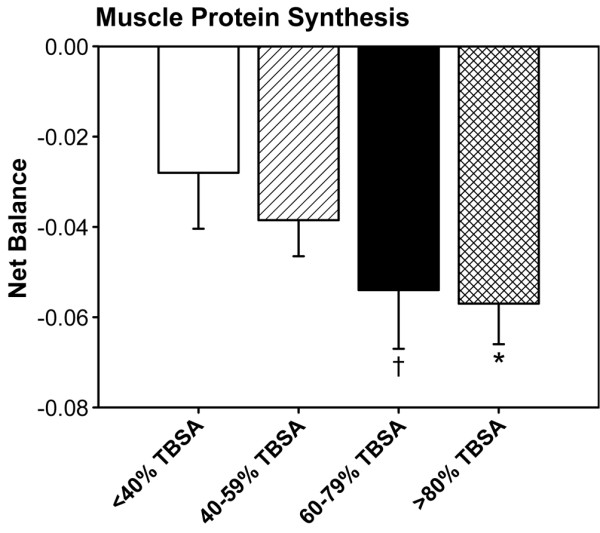
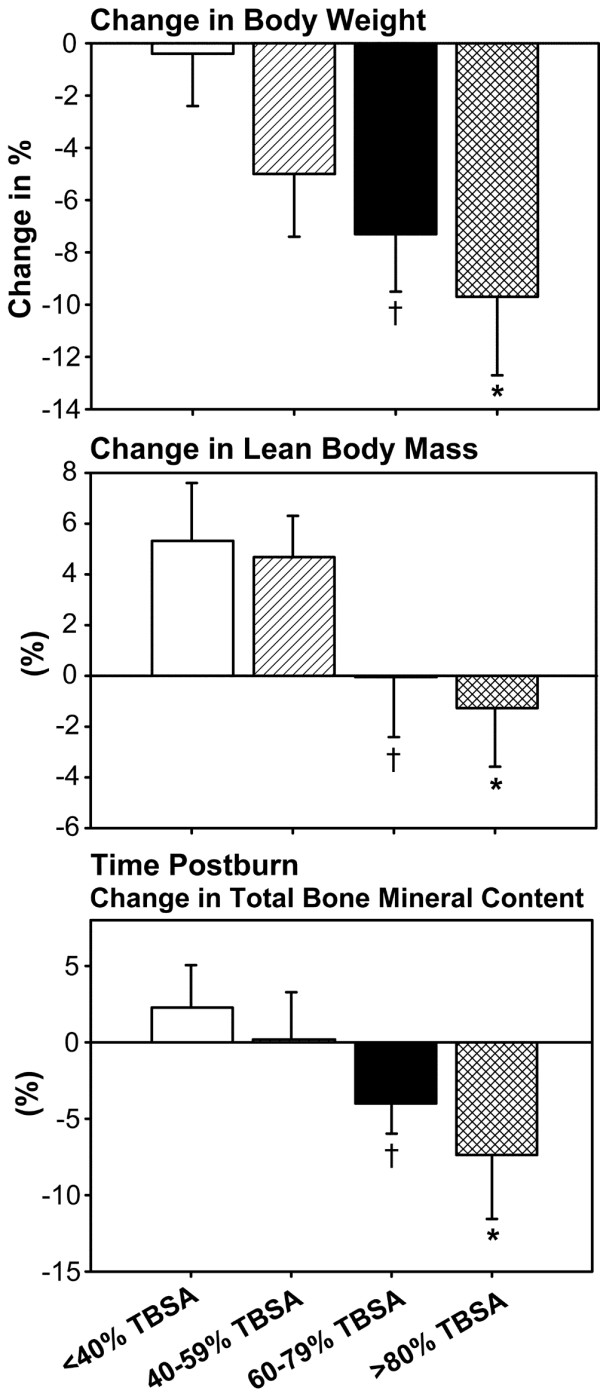
Methods: Pediatric burned patients were divided into four burn size groups: <40% total body surface area (TBSA) burn, 40-59% TBSA burn, 60-79% TBSA burn, and >80% TBSA burn. Demographic and clinical data, hypermetabolism, the inflammatory response, body composition, the muscle protein net balance, serum and urine hormones and proteins, and cardiac function and changes in liver size were determined.

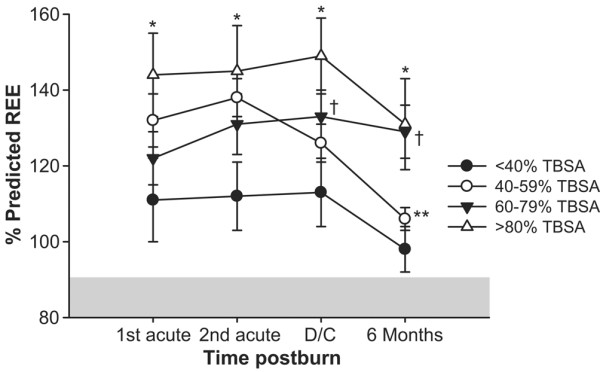
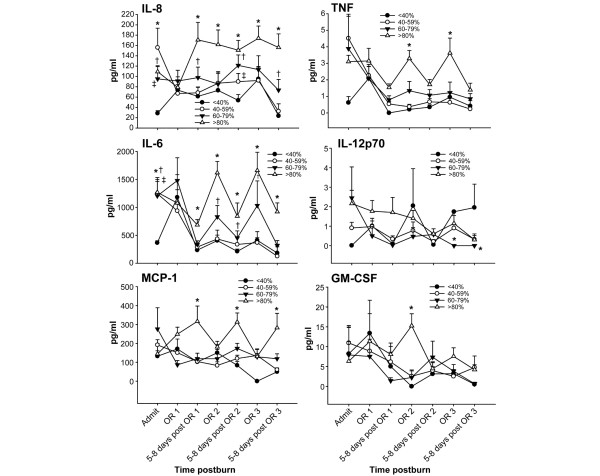
Results: One hundred and eighty-nine pediatric patients of similar age and gender distribution were included in the study (<40% TBSA burn, n = 43; 40-59% TBSA burn, n = 79; 60-79% TBSA burn, n = 46; >80% TBSA burn, n = 21). Patients with larger burns had more operations, a greater incidence of infections and sepsis, and higher mortality rates compared with the other groups (P < 0.05). The percentage predicted resting energy expenditure was highest in the >80% TBSA group, followed by the 60-79% TBSA burn group (P < 0.05). Children with >80% burns lost the most body weight, lean body mass, muscle protein and bone mineral content (P < 0.05). The urine cortisol concentration was highest in the 80-99% and 60-79% TBSA burn groups, associated with significant myocardial depression and increased change in liver size (P < 0.05). The cytokine profile showed distinct differences in expression of IL-8, TNF, IL-6, IL-12p70, monocyte chemoattractant protein-1 and granulocyte-macrophage colony-stimulating factor (P < 0.05).

Conclusion: Morbidity and mortality in burned patients is burn size dependent, starts at a 60% TBSA burn and is due to an increased hypermetabolic and inflammatory reaction, along with impaired cardiac function.


Figures

Figure 1
Figure 1
Percentage predicted resting energy expenditure. The highest percentage predicted resting energy expenditure (REE) was in children with burn >80% of their total body surface area (TBSA), followed by 60–79% TBSA burns. Children with large burns demonstrated persistent elevated percentage predicted REEs at 6 months postburn, while children with smaller burns approached the normal range. Measurements were performed at week 1 (1st acute), weeks 2–4 (2nd acute), discharge (D/C), and at 6 months postburn. *Significant difference between >80% TBSA burn group versus <40% TBSA burn group, P < 0.05. **Significant difference between >80% and 60–79% TBSA burn groups versus 40–59% TBSA burn group, P < 0.05. Significant difference between 60–79% TBSA burn group versus <40% TBSA burn group, P < 0.05.
Figure 2
Figure 2
Peripheral muscle protein net balance during acute hospitalization. All burned children had a negative net protein balance in skeletal muscle. The greatest muscle protein loss was found in children with 60–79% and >80% total body surface area (TBSA) burn. *Significant difference between >80% TBSA burn group versus <40% TBSA burn group, P < 0.05.
Figure 3
Figure 3
Change in body composition from admission to discharge. Children with >80% total body surface area (TBSA) burn lost the most body weight, lean body mass and bone mineral content compared with the other groups. The 60–79% TBSA burn group showed a significant loss in body weight, lean body mass and bone mineral content that was significant compared with the <40% and 40–59% TBSA groups. The <40% and 40–59% TBSA burn groups had almost no loss in body weight, lean body mass and bone mineral content. *Significant difference between >80% TBSA burn group versus <40% TBSA burn group, P < 0.05. Significant difference 60–79% TBSA burn group versus <40% TBSA burn group, P < 0.05.
Figure 4
Figure 4
Serum protein concentrations during acute hospitalization at multiple time points. Serum insulin growth factor-I (IGF-I) was significantly increased in the <40% and 40–59% total body surface area (TBSA) burn groups compared with the 60–79% and >80% TBSA burn groups 21–40 days postburn. At the later time point, serum insulin like growth factor binding protein-3 (IGFBP-3) was significantly higher in the <40% and 40–59% TBSA burn groups when compared with the other two burn groups. Serum growth hormone (GH) markedly decreased in burns of >40% TBSA and was significantly higher in burns of <40% TBSA. Serum insulin was significantly increased in large burns immediately after burn compared with the small burns. Urine cortisol was increased during the acute stay in all four groups. Urine cortisol, however, was significantly lower in the <40% TBSA burn group when compared with the other three groups. *Significant difference between >80% TBSA burn group versus <40% TBSA burn group, P < 0.05. Significant difference 60–79% TBSA burn group versus <40% TBSA burn group, P < 0.05. Normal levels: IGF-I, 220–260 pg/ml; IGFBP-3, 3,800–4,200 pg/ml; GH, 6 pg/ml; insulin, 10–25 mg/dl; and urine cortisol, 20–45 μg/24 hours.
Figure 5
Figure 5
Cytokine concentrations in relation to acute hospitalization. Cytokines were measured at admission (Admit), at first surgery (OR1), at 5–8 days postsurgery 1, at second surgery (OR2), at 5–8 days postsurgery 2, at third surgery (OR3), and again at 5–8 days postsurgery 3. Six cytokines out of 17 measured were significantly different between different burn sizes. Serum IL-8, TNF, IL-6, IL-12p70, monocyte chemoattractant protein-1 (MCP-1) and granulocyte–macrophage colony-stimulating factor (GM-CSF) were significantly increased in the large burns compared with the other three groups. *Significant difference between >80% TBSA burn group versus 60–79%, 40–59% and <40% TBSA burn groups, P < 0.05. Significant difference between 60–79% TBSA burn group versus 40–79% and <40% TBSA burn groups, P < 0.05. Significant difference between 40–59% TBSA burn group versus <40% TBSA burn group, P < 0.05. Normal levels: IL-8, 7.6 ± 3.9 pg/ml; TNF, 0.7 ± 0.07 pg/ml; IL-6, 8.7 ± 4.9 pg/ml; IL-12p70, 0 ± 0 pg/ml; MCP-1, 42 ± 5 pg/ml; and GM-CSF, 0 ± 0 pg/ml.
Figure 6
Figure 6
Cardiac function within 96 hours after hospital admission. The cardiac output and the predicted cardiac output (predicted CO) were significantly decreased in burns of >80% total body surface area (TBSA), while there was no difference between the three other burn groups. The predicted stroke volume was significantly decreased in the >80% TBSA burn group when compared with the other three groups. There were, however, no differences between groups in the heart rate, predicted heart rate, cardiac index, and central venous pressure. *Significant difference between >80% TBSA burn group versus 60–79%, 40–59% and <40% TBSA burn groups, P < 0.05.
Figure 7
Figure 7
Liver size increased by almost 100% immediately after burn in all groups. The liver size was significantly smaller in <40% total body surface area (TBSA) burns compared with the other groups. *Significant difference between <40% TBSA burn group versus 40–59%, 60–79% and >80% TBSA burn groups, P < 0.05. Measurements were performed at week 1 (Acute 1), at weeks 2–4 (Acute 2), at discharge (D/C), and at 6 months postburn.

Similar articles

Cited by

References

    1. Finnerty CC, Herndon DN, Przkora R, Pereira CT, Oliveira HM, Queiroz DM, Rocha AM, Jeschke MG. Cytokine expression profile over time in severely burned pediatric patients. Shock. 2006;26:13–19. doi: 10.1097/01.shk.0000223120.26394.7d. - DOI - PubMed
    1. Herndon DN, Tompkins RG. Support of the metabolic response to burn injury. Lancet. 2004;363:1895–1902. doi: 10.1016/S0140-6736(04)16360-5. - DOI - PubMed
    1. Pereira C, Murphy K, Jeschke M, Herndon DN. Post burn muscle wasting and the effects of treatments. Int J Biochem Cell Biol. 2005;37:1948–1961. doi: 10.1016/j.biocel.2005.05.009. - DOI - PubMed
    1. Przkora R, Barrow RE, Jeschke MG, Suman OE, Celis M, Sanford AP, Chinkes DL, Mlcak RP, Herndon DN. Body composition changes with time in pediatric burn patients. J Trauma. 2006;60:968–971. - PubMed
    1. Rennie MJ. Muscle protein turnover and the wasting due to injury and disease. Br Med Bull. 1985;41:257–264. - PubMed

Publication types

MeSH terms