

Human cytomegalovirus and human immunodeficiency virus type-1 co-infection in human cervical tissue
- PMID: 17716703
- PMCID: PMC2174066
- DOI: 10.1016/j.virol.2007.07.008
Human cytomegalovirus and human immunodeficiency virus type-1 co-infection in human cervical tissue
Abstract
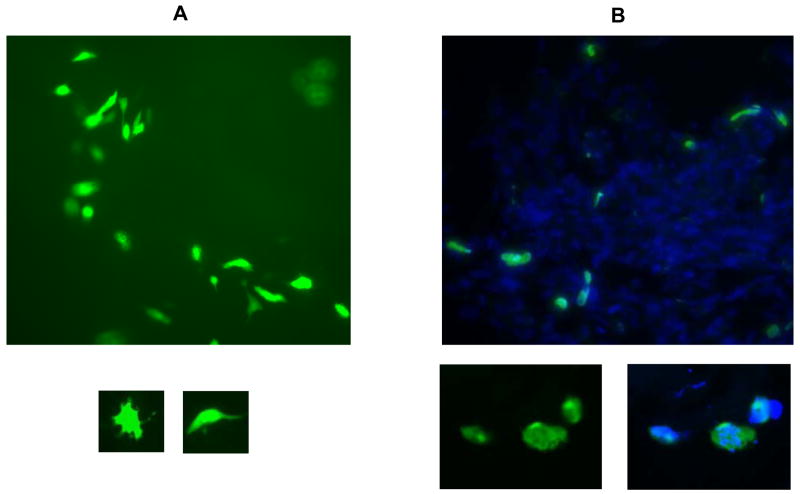
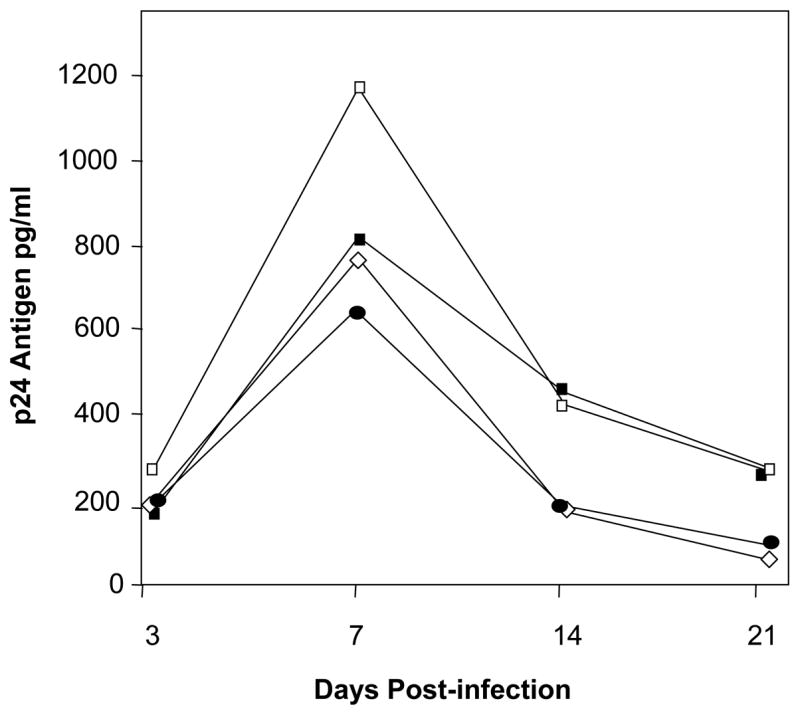
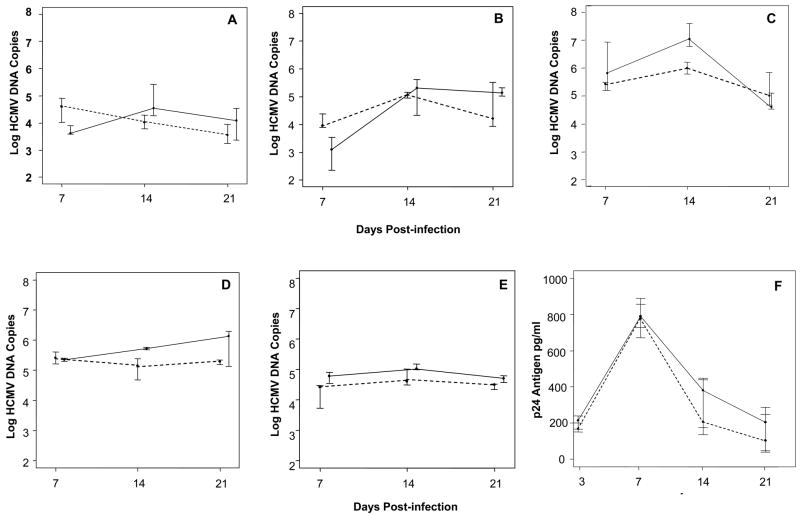
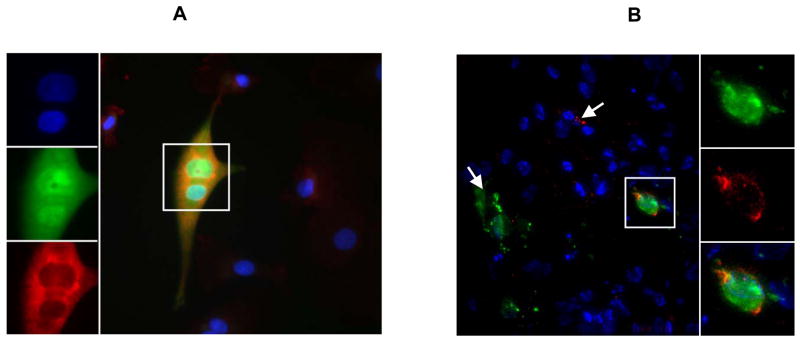
Human cytomegalovirus (HCMV) and human immunodeficiency virus type-1 (HIV-1) infect the female genital tract. A human cervical explant model was developed to study single and dual infection by these viruses in the genital compartment. An HCMV strain expressing green fluorescent protein, and two clinical HCMV strains produced peak viral DNA copies at 14 to 21 days post-infection. Peak levels of HIV-1(Ba-L) p24 antigen occurred at 7 days post-infection. HIV-1(Ba-L) appeared to enhance HCMV in co-infected tissues. Singly and dually infected explants produced increased levels of cytokines IL-6, IL-8, and GRO-alpha in culture supernatants. Immunohistochemical and flow cytometric analysis showed HCMV infection of leukocytes with the phenotype CD45+/CD1a+/CD14+/HLA-DR+ but not stromal or endothelial cells. Cells expressing both GFP and HIV-1 p24 antigen were detected in co-infected tissues. The cervical explants provide an ex vivo human model for examining mechanisms of virus-virus interaction and pathogenesis in clinically relevant tissue.
Figures
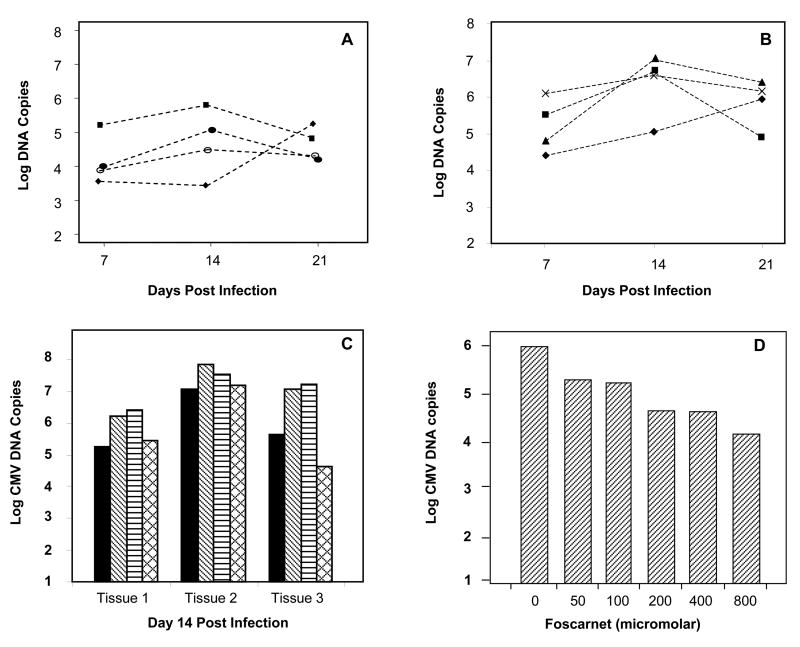
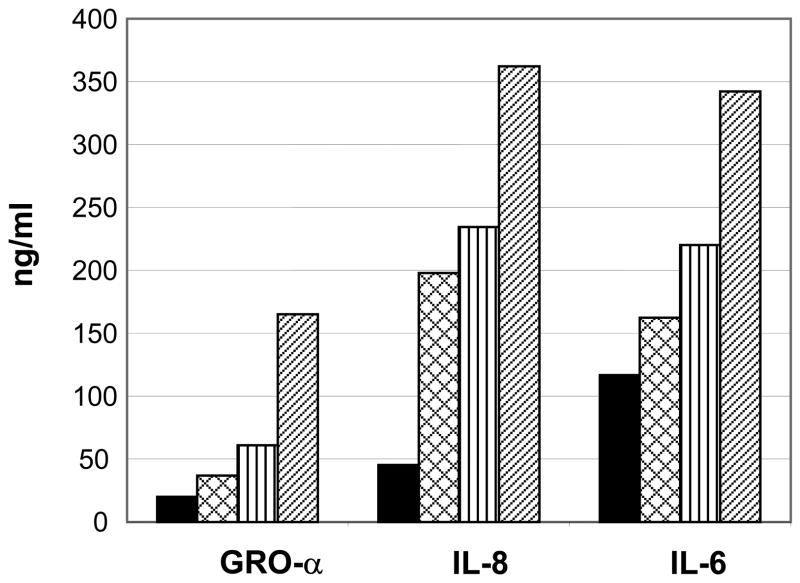
 ): uninfected control tissue; Cross-hatch bar (
 ): CMVPT30-gfp; Vertical bar (
 ): HIV-1Ba-L; Diagonal bar (
 ): CMVPT30-gfp/HIV-1Ba-L co-infection. Supernatants were collected at 14 days p.i.
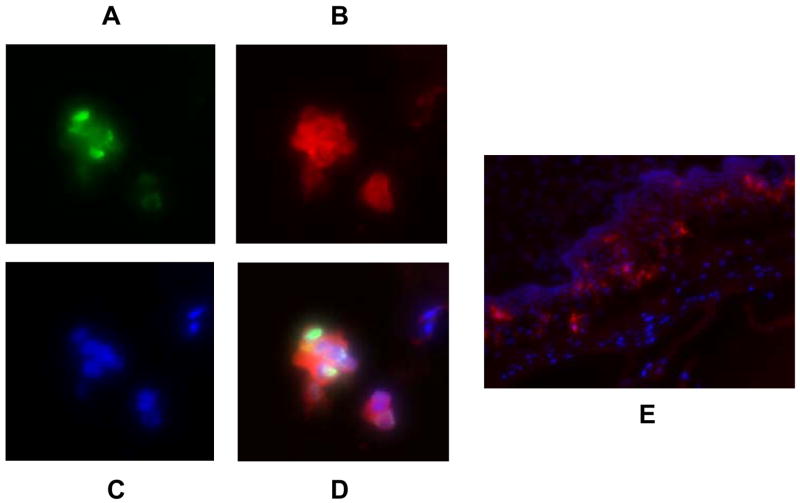

Similar articles
-
Human cytomegalovirus-mediated enhancement of human immunodeficiency virus type-1 production in monocyte-derived macrophages.Virology. 1994 Feb 15;199(1):98-104. doi: 10.1006/viro.1994.1101. Virology. 1994. PMID: 8116259
-
Upregulation of human cytomegalovirus by HIV type 1 in human lymphoid tissue ex vivo.AIDS Res Hum Retroviruses. 2008 Mar;24(3):453-62. doi: 10.1089/aid.2007.0155. AIDS Res Hum Retroviruses. 2008. PMID: 18327985
-
Coinfection of individual leukocytes with human cytomegalovirus and human immunodeficiency virus is a rare event in vivo.J Med Virol. 1996 Aug;49(4):283-8. doi: 10.1002/(SICI)1096-9071(199608)49:4<283::AID-JMV5>3.0.CO;2-#. J Med Virol. 1996. PMID: 8877760
-
[Interrelationship between human cytomegalovirus infection and chemokine].Nihon Rinsho. 1998 Jan;56(1):69-74. Nihon Rinsho. 1998. PMID: 9465667 Review. Japanese.
-
Pathogenesis of human cytomegalovirus infection and cellular targets.Hum Immunol. 2004 May;65(5):381-6. doi: 10.1016/j.humimm.2004.02.009. Hum Immunol. 2004. PMID: 15172435 Review.
Cited by
-
Imaging and tracking HIV viruses in human cervical mucus.J Biomed Opt. 2016 Sep 1;21(9):96001. doi: 10.1117/1.JBO.21.9.096001. J Biomed Opt. 2016. PMID: 27598560 Free PMC article.
-
Cervico-vaginal tissue ex vivo as a model to study early events in HIV-1 infection.Am J Reprod Immunol. 2011 Mar;65(3):268-78. doi: 10.1111/j.1600-0897.2010.00967.x. Epub 2011 Jan 12. Am J Reprod Immunol. 2011. PMID: 21223429 Free PMC article.
-
Movements of HIV-virions in human cervical mucus.Biomacromolecules. 2009 Sep 14;10(9):2482-8. doi: 10.1021/bm900344q. Biomacromolecules. 2009. PMID: 19711976 Free PMC article.
-
Determinants of HIV shedding in the lower genital tract of women.Curr Infect Dis Rep. 2008 Nov;10(6):505-11. doi: 10.1007/s11908-008-0082-z. Curr Infect Dis Rep. 2008. PMID: 18945393
-
Clinical parameters essential to methodology and interpretation of mucosal responses.Am J Reprod Immunol. 2011 Mar;65(3):352-60. doi: 10.1111/j.1600-0897.2010.00947.x. Epub 2011 Jan 12. Am J Reprod Immunol. 2011. PMID: 21223419 Free PMC article. Review.
References
-
- Angel CE, George E, Brooks AE, Ostrovsky LL, Brown TL, Dunbar PR. Cutting edge: CD1a+ antigen-presenting cells in human dermis respond rapidly to CCR7 ligands. J Immunol. 2006;176(10):5730–4. - PubMed
-
- Arcasoy SM, Kotloff RM. Lung transplantation. N Engl J Med. 1999;340(14):1081–91. - PubMed
-
- Baig J, Levy DB, McKay PF, Schmitz JE, Santra S, Subbramanian RA, Kuroda MJ, Lifton MA, Gorgone DA, Wyatt LS, Moss B, Huang Y, Chakrabarti BK, Xu L, Kong WP, Yang ZY, Mascola JR, Nabel GJ, Carville A, Lackner AA, Veazey RS, Letvin NL. Elicitation of simian immunodeficiency virus-specific cytotoxic T lymphocytes in mucosal compartments of rhesus monkeys by systemic vaccination. J Virol. 2002;76(22):11484–90. - PMC - PubMed
-
- Bego MG, St Jeor S. Human cytomegalovirus infection of cells of hematopoietic origin: HCMV-induced immunosuppression, immune evasion, and latency. Exp Hematol. 2006;34(5):555–70. - PubMed
-
- Boppana SB, Rivera LB, Fowler KB, Mach M, Britt WJ. Intrauterine transmission of cytomegalovirus to infants of women with preconceptional immunity. N Engl J Med. 2001;344(18):1366–71. - PubMed
Publication types
MeSH terms
Substances
Grants and funding
LinkOut - more resources
Full Text Sources
Other Literature Sources
Medical
Research Materials
Miscellaneous
