. 2007 Dec 1;176(11):1161-8.
doi: 10.1164/rccm.200702-255OC. Epub 2007 Aug 23.

Alcohol ingestion by donors amplifies experimental airway disease after heterotopic transplantation

Affiliations

Alcohol ingestion by donors amplifies experimental airway disease after heterotopic transplantation

Patrick O Mitchell et al. Am J Respir Crit Care Med. .

Abstract

Rationale: Obliterative bronchiolitis (OB) after lung transplantation is triggered by alloimmunity, but is ultimately mediated by transforming growth factor (TGF)-beta(1)-dependent airway fibrosis.

Objectives: Chronic alcohol use increases TGF-beta(1) expression and renders the lung susceptible to injury. Therefore, we hypothesized that donor alcohol abuse could prime the lung allograft for OB, as many organ donors have a history of alcohol abuse.

Methods: Tracheas from control and alcohol-fed rats (8 wk) were heterotopically transplanted into recipients with varying degrees of alloimmune mismatch and analyzed for obliterative airway disease severity on Postoperative Day 21.

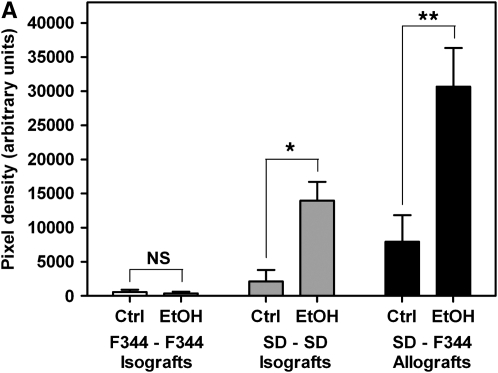
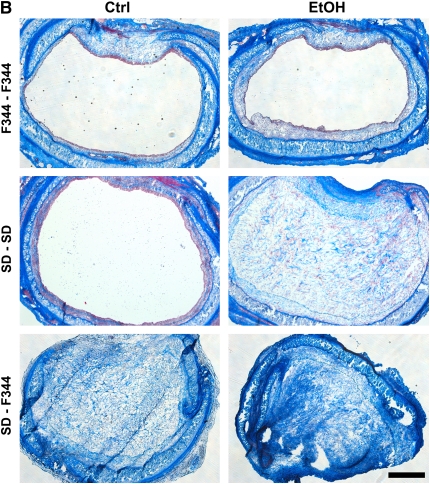
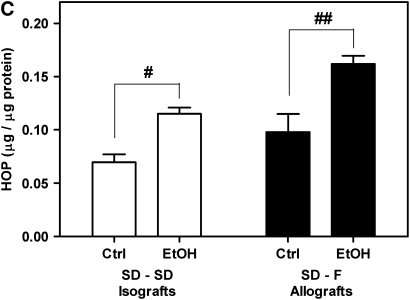
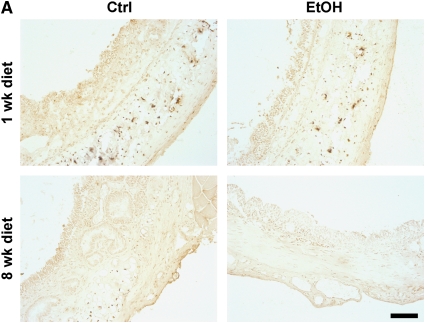
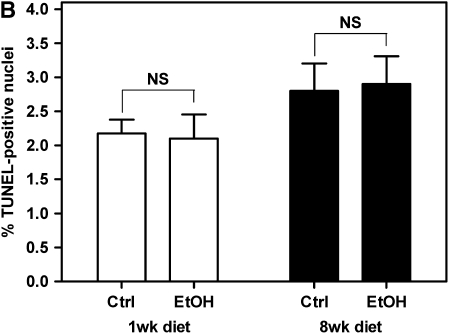
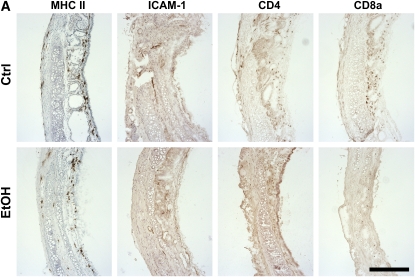
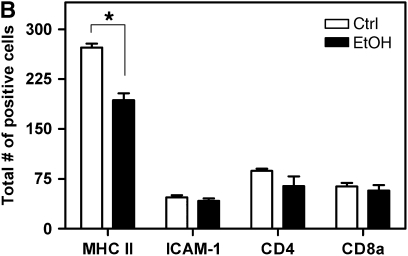
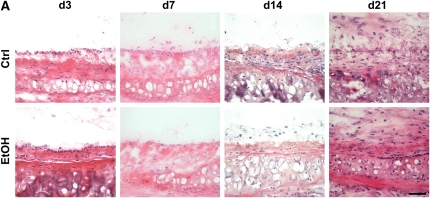
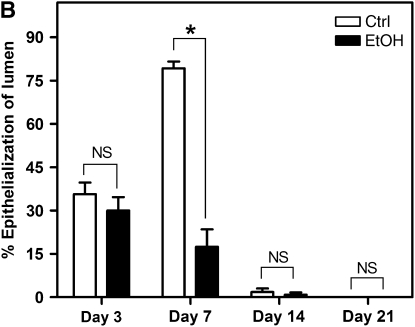
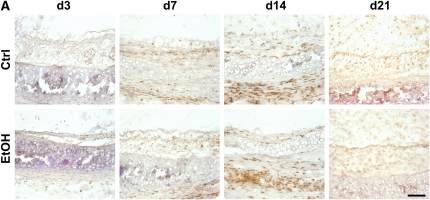
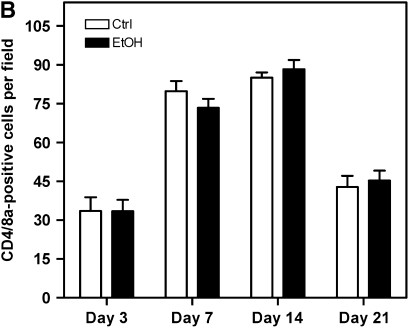
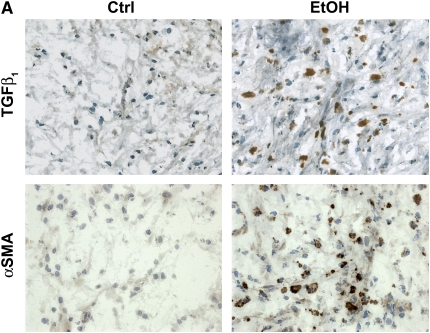
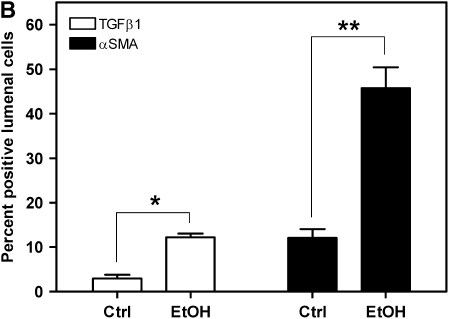
Measurements and main results: Although donor alcohol ingestion did not increase the number of antigen-presenting cells or infiltrating lymphocytes, it nevertheless increased allograft lumenal collagen content fourfold compared with allografts from control donors. In parallel, alcohol increased TGF-beta(1) and alpha-smooth muscle actin expression in allografts. Alcohol amplified airway disease even in isografts with minor alloimmune mismatches. In contrast, it did not cause any airway disease in isografts in a pure isogenic background, suggesting that a minimal alloimmune response is necessary to trigger alcohol-induced airway fibrosis.

Conclusions: Although alloimmune inflammation is required to initiate airway disease, alcohol primes the allograft for greater TGF-beta(1) expression, myofibroblast transdifferentiation, and fibrosis than by alloimmune inflammation alone. This has serious clinical implications, as many lung donors have underlying alcohol abuse that may prime the allograft recipient for subsequent OB.


Figures

<b>Figure 1.</b>
Figure 1.
Donor alcohol ingestion exacerbates obliterative airway disease, depending on the degree of alloimmune mismatch. (A) Quantification of Masson's trichrome nlue staining of 21-day isografts and allografts from control (Ctrl) and alcohol-fed (EtOH) donor rats. No significant difference was observed between control (n = 4) and alcohol (n = 4) groups for Fischer 344 (F344)–F344 isografts. Statistical significance was observed between control (n = 8) and ethanol (n = 7) groups for Sprague Dawley (SD)–SD isografts (*P < 0.05), and control (n = 10) and ethanol (n = 12) SD–F344 allografts (**P < 0.05). (B) Masson's Trichrome Blue histology staining of F344–F344 isografts (top panels), SD–SD isografts (middle panels), and SD–F344 allografts (bottom panels). Scale bar = 500 μm. (C) Hydroxyproline (HOP) content (indicative of collagen content) is significantly increased in SD–SD isografts (#P < 0.05) and SD–F344 allografts (##P < 0.05) from ethanol-fed donors.
<b>Figure 2.</b>
Figure 2.
Pretransplant airway epithelium viability is not compromised in alcohol-fed SD donors. (A) Terminal deoxynucleotidyl transferase–mediated dUTP nick-end labeling (TUNEL) staining of pretransplant tracheal sections at 1-week ethanol diet (top panels) and 8-week ethanol diet (bottom panels). TUNEL-positive nuclei were not observed in the airway epithelium of any groups. Scale bar = 100 μm. (B) Quantification of TUNEL staining in the airway subepithelial layers. No significant differences were observed in the prevalence of TUNEL-positive cells between control (n = 4) and alcohol-fed (n = 4) donors at either 1 or 8 weeks of dietary ethanol (P > 0.05). NS = not significant.
<b>Figure 3.</b>
Figure 3.
Pretransplant airways from alcohol-fed SD donors do not appear to be primed to heightened alloimmune injury. (A) Untransplanted tracheal sections (8-wk dietary ethanol) were analyzed by immunohistochemical staining for major histocompatibility complex (MHC) II, intercellular adhesion molecule (ICAM)-1, CD4, and CD8a expression. Scale bar = 250 μm. (B) Quantification of MHC II–, ICAM-1–, CD4-, and CD8a-positive cells in untransplanted tracheal sections. MHC II expression is decreased approximately 50% in sections from alcohol-fed donors (*P < 0.05); however, no significant differences were noted between control (open bars) and alcohol (closed bars) groups for ICAM-1, CD4, or CD8a (n = 4 for each group).
<b>Figure 4.</b>
Figure 4.
Donor alcohol ingestion exacerbates epithelial injury post-transplantation. (A) Sections from 3-, 7-, 14-, and 21-day allografts originating from control (top panels) or alcohol-fed (bottom panels) donors were stained with H&E. Areas highlighting the epithelium are shown in representative H&E images from each group. Scale bar = 50 μm. (B) Quantification of the degree of epithelialization of allografts from control (open bars) or alcohol-fed (closed bars) donors at Days 3, 7, 14, and 21 post-transplantation (n = 4–5 for each group; *P < 0.05). NS = not significant.
<b>Figure 5.</b>
Figure 5.
Lymphocytic infiltration is not increased in allografts originating from alcohol-fed donors. (A) Sections from 3-, 7-, 14-, and 21-day allografts originating from control or alcohol-fed donors were immunostained for CD8a. Representative CD8a (brown staining) images from each group show the allograft lumen/epithelial/subepithelial region. Scale bar = 100 μm. (B) Quantification of CD4- and CD8a-positive cells reveals no difference in the percentage of infiltrating T lymphocytes in allografts from control (open bars) or alcohol-fed (closed bars) donors (n = 4 each group).
<b>Figure 6.</b>
Figure 6.
Allografts originating from alcohol-fed donors display increased transforming growth factor (TGF)-β1 and α-smooth muscle actin (SMA) expression. (A) TGF-β1 (top panels) and α-SMA (bottom panels) immunohistochemical stain (brown) and hematoxylin counterstaining (blue) of 21-day allografts from control and alcohol-fed rats. Note the increased TGF-β1 and α-SMA staining in allografts from alcohol-fed versus control rats. Scale bar = 50 μm. (B) Quantification of TGF-β1– and α-SMA–positive cells reveals a significant increase in the percentage of TGF-β1– (open bars; *P < 0.05) and α-SMA (closed bars; **P < 0.05)–positive cells within the lumen of allografts (fourfold and threefold increase, respectively) (n = 4 each group).

References

    1. Boehler A, Kesten S, Weder W, Speich R. Bronchiolitis obliterans after lung transplantation: a review. Chest 1998;114:1411–1426. - PubMed
    1. Boehler A, Estenne M. Post-transplant bronchiolitis obliterans. Eur Respir J 2003;22:1007–1018. - PubMed
    1. Sharples LD, McNeil K, Stewart S, Wallwork J. Risk factors for bronchiolitis obliterans: a systematic review of recent publications. J Heart Lung Transplant 2002;21:271–281. - PubMed
    1. Scholma J, Slebos DJ, Boezen HM, van den Berg JW, van der Bij W, de Boer WJ, Koeter GH, Timens W, Kauffman HF, Postma DS. Eosinophilic granulocytes and interleukin-6 level in bronchoalveolar lavage fluid are associated with the development of obliterative bronchiolitis after lung transplantation. Am J Respir Crit Care Med 2000;162:2221–2225. - PubMed
    1. DiGiovine B, Lynch JP III, Martinez FJ, Flint A, Whyte RI, Iannettoni MD, Arenberg DA, Burdick MD, Glass MC, Wilke CA, et al. Bronchoalveolar lavage neutrophilia is associated with obliterative bronchiolitis after lung transplantation: role of IL-8. J Immunol 1996;157:4194–4202. - PubMed

Publication types

MeSH terms