. 2007 Sep;117(9):2658-71.
doi: 10.1172/JCI31093.

Discovery of common human genetic variants of GTP cyclohydrolase 1 (GCH1) governing nitric oxide, autonomic activity, and cardiovascular risk

Affiliations

Discovery of common human genetic variants of GTP cyclohydrolase 1 (GCH1) governing nitric oxide, autonomic activity, and cardiovascular risk

Lian Zhang et al. J Clin Invest. 2007 Sep.

Abstract

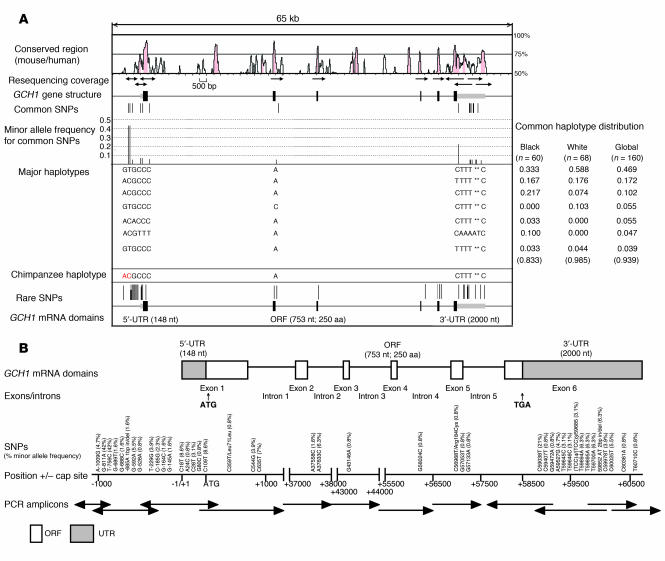
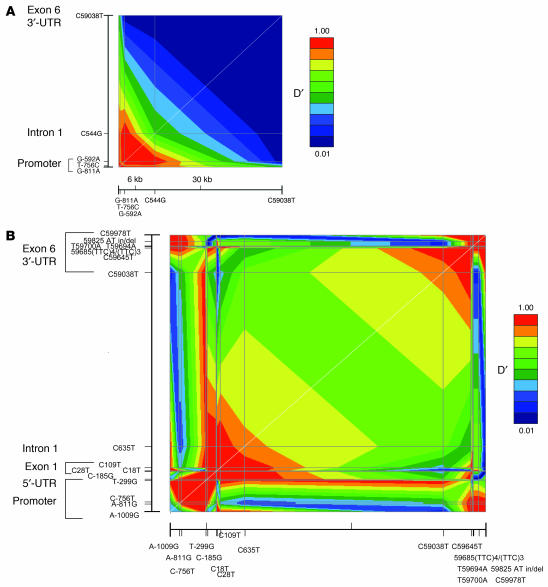
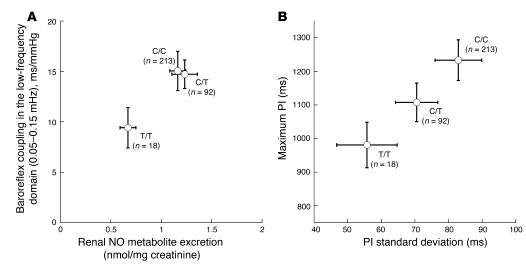
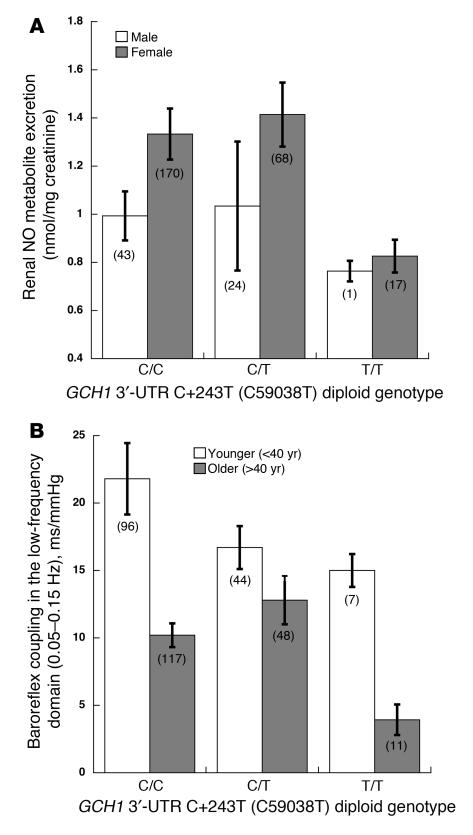
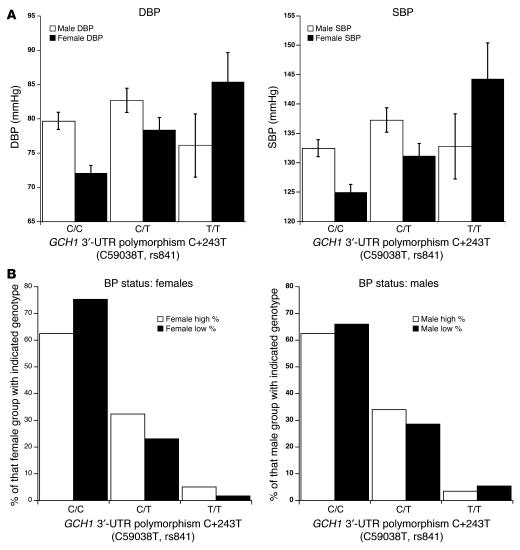
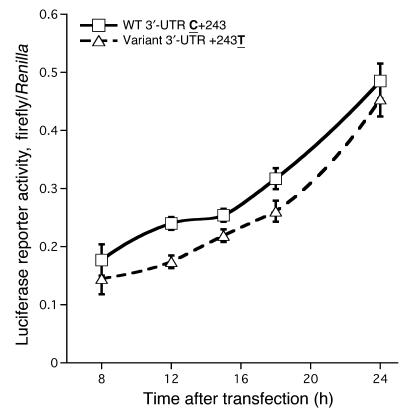
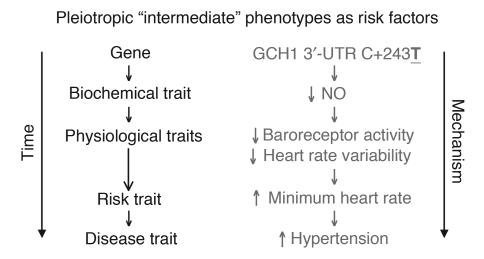
GTP cyclohydrolase 1 (GCH1) is rate limiting in the provision of the cofactor tetrahydrobiopterin for biosynthesis of catecholamines and NO. We asked whether common genetic variation at GCH1 alters transmitter synthesis and predisposes to disease. Here we undertook a systematic search for polymorphisms in GCH1, then tested variants' contributions to NO and catecholamine release as well as autonomic function in twin pairs. Renal NO and neopterin excretions were significantly heritable, as were baroreceptor coupling (heart rate response to BP fluctuation) and pulse interval (1/heart rate). Common GCH1 variant C+243T in the 3'-untranslated region (3'-UTRs) predicted NO excretion, as well as autonomic traits: baroreceptor coupling, maximum pulse interval, and pulse interval variability, though not catecholamine secretion. In individuals with the most extreme BP values in the population, C+243T affected both diastolic and systolic BP, principally in females. In functional studies, C+243T decreased reporter expression in transfected 3'-UTRs plasmids. We conclude that human NO secretion traits are heritable, displaying joint genetic determination with autonomic activity by functional polymorphism at GCH1. Our results document novel pathophysiological links between a key biosynthetic locus and NO metabolism and suggest new strategies for approaching the mechanism, diagnosis, and treatment of risk predictors for cardiovascular diseases such as hypertension.


Figures

Figure 1
Figure 1. Polymorphism at GCH1: distribution across the gene.
(A) Local genomic region. GCH1 resequencing strategy and identified variants. Sequences conserved between mouse and human GCH1 were visualized with VISTA (http://genome.lbl.gov/vista/index.shtml). Location of common (upper) and rare (lower) SNPs relative to exons and conserved noncoding sequences is indicated by position. Red lines represent nonsynonymous SNPs, while black rods represent synonymous SNPs. Nucleotides in red in the chimpanzee haplotype indicate the minor allele in the human sequence. Computationally reconstructed haplotypes are indicated, along with their relative frequencies in ethnogeographic groups within our sample population. Nucleotide deletions in haplotype sequences are indicated by an asterisk. n = 42 variants were discovered; n = 13 were common (≥5%), while n = 29 were rare (<5%). (B) Functional domains and coding region SNPs. The distribution of variants across GCH1 exons and functional protein domains is illustrated. ATG, translational start codon; Cap, transcriptional initiation site; ORF, open reading frame.
Figure 2
Figure 2. Human GCH1 polymorphisms: patterns of LD across the entire GCH1 locus.
Graphical Overview of LD (GOLD) plots of point-by-point linkage disequilibrium (LD). The white diagonal is the line of identity (y = x). (A) European (white) ancestry. Five SNPs with high minor allele frequencies (>5%) spanning the GCH1 locus, and proceeding approximately 1.2 kbp upstream (5′; promoter region). This LD plot was constructed using data from n = 198 individuals (1 MZ twin/pair, both DZ twins/pair, and parents). (B) Sub-Saharan African (black, African-American) ancestry. Sixteen SNPs with high minor allele frequencies (>5%) spanning the GCH1 locus and proceeding approximately 1.2 kbp upstream (5′; promoter region). This LD plot was constructed using data from n = 30 unrelated individuals. in/del, insertion/deletion.
Figure 3
Figure 3. GCH1 3′-UTRs (C+243T) polymorphism effects on biochemical and physiological traits in twin pairs.
(A) Baroreflex coupling as a function of renal NO (NO•) production. Univariate effects of C+243T on each trait are shown. Baroreflex coupling was determined in the low-frequency domain (0.05–0.15 Hz). Renal NO production was normalized to the concentration of creatinine in the same urine sample. Univariate NO: χ2 = 9.50, P = 0.0086. Univariate baroreflex: χ2 = 6.37, P = 0. 0414. Alleles: C = 80.2%, T = 19.8%. Hardy-Weinberg equilibrium (HWE), χ2 = 1.76, P = 0.184. (B) Minimum resting heart rate as a function of heart rate variability. Univariate effects of C+243T on each trait are shown. Heart rate variability, in the resting state, was determined as pulse interval (PI) SD (ms) over 5 minutes of monitoring in the time domain. Minimum resting heart rate was determined as maximum (max) PI (ms) during the same monitoring period. Univariate PI SD: χ2 = 6.0, P = 0.0498. Univariate PI max: χ2 = 9.78, P = 0. 0075. Alleles: C = 80.2%, T = 19.8%. HWE, χ2 = 1.76, P = 0.184.
Figure 4
Figure 4. GCH1 3′-UTRs C+243T genotype interactions on trait determination in twin pairs: sex and age.
Interactions were suspected based on the independent effects of sex and age on crucial traits (Table 3) and then tested by generalized estimating equations (GEEs). (A) Genotype-by-sex interaction on renal NO excretion. GEE χ2 = 9.50, P = 0.029. (B) Genotype-by-age interaction on baroreflex coupling in the low-frequency domain (0.05–0.15 Hz). Subjects were dichotomized as older or younger than 40 years. GEE χ2 = 23.4, P = 0.0001.
Figure 5
Figure 5. Hypertension.
Intermediate phenotype–associated GCH1 variant C+243T was typed in n = 1,049 subjects selected from the most extreme DBPs (high and low) in a primary care population of more than 53,000 individuals. (A) DBP and SBP as a function of diploid genotype. Results were analyzed by 2-way ANOVA, factoring for genotype, sex, and genotype-by-sex interaction. DBP, ANOVA: genotype F = 4.81, P = 0.008; sex F = 0.150, P = 0.698; gene-by-sex F = 3.08, P = 0.046; alleles C = 81%, T= 19%. HWE: χ2 = 0.724, P = 0.395; males alone: F = 1.43, P = 0.240; females alone: F = 6.21, P = 0.002. SBP, ANOVA: genotype F = 4.84, P = 0.008; sex F = 1.49, P = 0.700; gene-by-sex F = 2.19, P = 0.112; alleles C = 81%, T = 19%. HWE: χ2 = 0.724, P = 0.395; males alone: F = 1.52, P = 0.220; females alone: F = 5.06, P = 0.007. (B) BP status (high versus low) as a function of diploid genotype. Subjects were grouped by sex and C+243T diploid genotype. Results were analyzed by permutation testing on 3-by-2 contingency tables. Gene-by-diagnosis permutation: females, P = 0.00082; males, P = 0.155.
Figure 6
Figure 6. Effect of GCH1 3′-UTRs polymorphism on gene expression in vitro.
3′-UTRs expression plasmids were transfected into PC12 chromaffin cells. After continued cell growth for 8–24 hours after transfection, cells were harvested for assay of firefly luciferase as well as the cotransfected Renilla luciferase reporter pRL-CMV. Results of triplicate transfections are expressed as the ratio of firefly/Renilla luciferase activity and were analyzed by 2-way ANOVA, factoring for the effects of 3′-UTRs and time. 2-Way repeated measures ANOVA: plasmid (3′-UTRs) F = 12.04, P = 0.013; time F = 163.6, P < 0.001.
Figure 7
Figure 7. The GCH1 isoform 1 (NT_00016) 3′-UTRs spans 2,009 bp (human chromosome 14, 54378476-54380484).
The alignment shown spans 60 bp flanking the polymorphism (at position 54380242 on chromosome 14). The polymorphic base (human C+243T) is shown in uppercase bold type. Asterisk indicates that the position is identical in all primates shown. The chimpanzee, gorilla, and orangutan sequences were newly determined here.
Figure 8
Figure 8. Intermediate phenotypes.
In the “intermediate phenotype” schema, biochemical traits (such as NO production) are postulated to be determined earlier and more proximately by genotype (such as GCH1 3′-UTRs C+243T) than are physiological traits (such as heart rate variability and resting heart rate) and, ultimately, late-penetrance disease (such as cardiovascular disease, hypertension, or sudden death). Here the concept is illustrated by the findings at GCH1 in the current study: the GCH1 3′-UTRs variant C+243T initially alters NO production, subsequently influencing baroreceptor coupling and heart variability, later minimum resting heart rate, and finally basal BP in the population.

References

    1. Serova L., Nankova B., Rivkin M., Kvetnansky R., Sabban E.L. Glucocorticoids elevate GTP cyclohydrolase I mRNA levels in vivo and in PC12 cells. Brain Res. Mol. Brain Res. 1997;48:251–258. - PubMed
    1. Furukawa Y., et al. Dystonia with motor delay in compound heterozygotes for GTP-cyclohydrolase I gene mutations. Ann. Neurol. 1998;44:10–16. - PubMed
    1. Hyland K., Gunasekara R.S., Munk-Martin T.L., Arnold L.A., Engle T. The hph-1 mouse: a model for dominantly inherited GTP-cyclohydrolase deficiency. Ann. Neurol. 2003;54(Suppl. 6):S46–S48. - PubMed
    1. Schmidt K., Werner E.R., Mayer B., Wachter H., Kukovetz W.R. Tetrahydrobiopterin-dependent formation of endothelium-derived relaxing factor (nitric oxide) in aortic endothelial cells. Biochem. J. 1992;281:297–300. - PMC - PubMed
    1. Vasquez-Vivar J., et al. Superoxide generation by endothelial nitric oxide synthase: the influence of cofactors. Proc. Natl. Acad. Sci. U. S. A. 1998;95:9220–9225. - PMC - PubMed

Publication types

MeSH terms