. 2008 Jan;184(1):61-70.
doi: 10.1007/s00221-007-1081-2. Epub 2007 Aug 24.

Depth cues, rather than perceived depth, govern vergence

Affiliations

Depth cues, rather than perceived depth, govern vergence

D A Wismeijer et al. Exp Brain Res. 2008 Jan.

Abstract

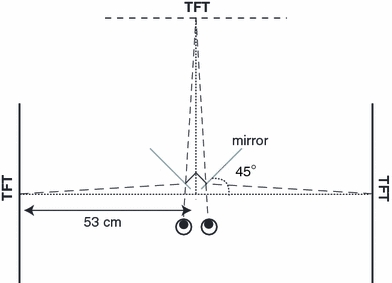
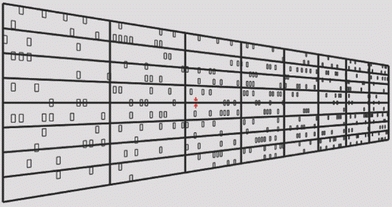
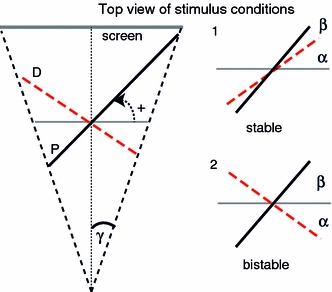
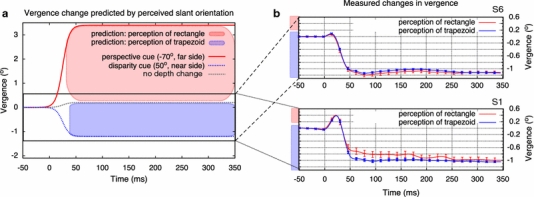
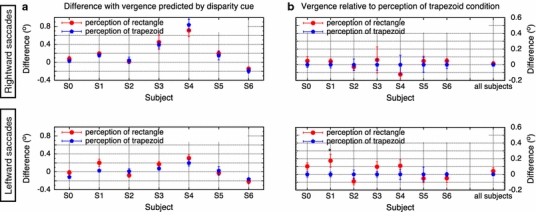
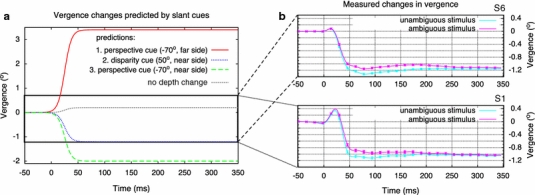
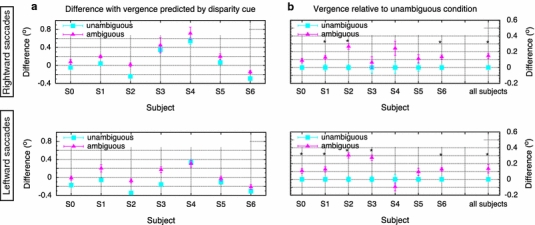
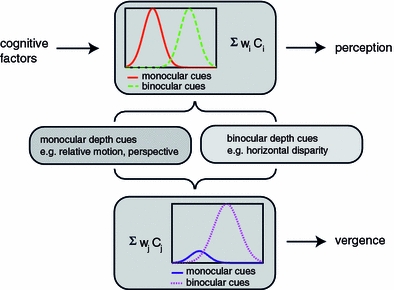
We studied the influence of perceived surface orientation on vergence accompanying a saccade while viewing an ambiguous stimulus. We used the slant rivalry stimulus, in which perspective foreshortening and disparity specified opposite surface orientations. This rivalrous configuration induces alternations of perceived surface orientation, while the slant cues remain constant. Subjects were able to voluntarily control their perceptual state while viewing the ambiguous stimulus. They were asked to make a saccade across the perceived slanted surface. Our data show that vergence responses closely approximated the vergence response predicted by the disparity cue, irrespective of voluntarily controlled perceived orientation. However, comparing the data obtained while viewing the ambiguous stimulus with data from an unambiguous stimulus condition (when disparity and perspective specified similar surface orientations) revealed an effect of perspective cues on vergence. Collectively our results show that depth cues rather than perceived depth govern vergence.


Figures

Fig. 1
Fig. 1
Wheatstone stereoscope. Subjects viewed one TFT display with the corresponding eye via one of the mirrors. The viewing distance (eye-mirror-display) was 57 cm. Note that the subjects were in reality much closer to the mirrors than depicted here and that there was no crossover, i.e. each eye could only see via one mirror
Fig. 2
Fig. 2
An image as shown on one display. Perspective foreshortening indicates a slant of 70°. The disparity gradient was produced by horizontally scaling the two eyes’ half images. The red fixation cross is positioned in the center of the stimulus
Fig. 3
Fig. 3
a The subtended angle from center to left or right side of the stimulus was 10° (γ) irrespective of the imposed surface slants defined by disparity (D) and perspective (P). A counter clockwise rotation of the surface about the vertical axis is defined as a positive surface slant angle (+). b Examples of different stimulus conditions. The surface slant angle as defined by disparity was ±50° (α) and the perspective defined surface slant angle (β) was ± 70°. In the unambiguous stimulus, disparity and perspective defined the same surface orientation yielding a stable perception of surface slant (1). Whereas in the ambiguous stimulus condition (2), the orientations of the defined surfaces were opposite, giving a bistable perception of surface slant
Fig. 4
Fig. 4
a Predicted vergence changes based on perceived surface slant orientation. The transitions between vergence at saccade onset (t = 0 ms) and at saccade offset are described using a sigmoid function. The upper and lower limits of the predicted vergence regions are based on the vergence step corresponding with the depth defined by a single cue. The box indicates the range of the detailed graphs in b. b Vergence changes based on perceived surface slant orientation of subject S6 (top) and subject S1 (bottom). Mean traces for each condition with SE of every fourth data point are displayed. Saccade offset occurred at 55 ms for S6 and at 46 ms for S1 conform main sequence characteristics (saccade onset at t = 0 ms). These data show that (1) saccade offset does not coincide with offset of preprogrammed vergence per se, (2) that the “perception of rectangle” condition is more converging than the “perception of trapezoid” condition from S6, which is opposite to the traces of S1
Fig. 5
Fig. 5
a Vergence (mean and SE selected as described in Sect. 2.4) relative to predicted vergence based on the disparity cue (0 on vertical axis) from leftward saccade trials (bottom) and rightward saccade trials (top). These data show that (1) there are individual biases (e.g. S4), (2) the “perception of rectangle” (red circle) is not less convergent than the “perception of trapezoid” (blue pentagon) condition for all subjects (e.g. S2, S5) and both directions (e.g. S4, S6), rebutting the predictions based on perception. b Vergence (mean and SE selected as described in Sect. 2.4) relative to “perception of a trapezoid” condition (0 on vertical axis). On the right side of these graphs the mean (and SE) of all subjects is shown. There is no systematic trend visible across subjects. All differences are nonsignificant except for S1, leftward saccade (F = 6.36, P < 0.05)
Fig. 6
Fig. 6
a Predicted vergence changes based on the slant cues of the stimulus. The predicted values are based on the depth defined by a single cue. Details similar as in Fig. 4. b Vergence changes from ambiguous and unambiguous stimulus trials of subject S6 (top) and subject S1 (bottom). Mean traces of each condition with SE of every fourth data point are displayed. Saccade offset occurred at 56 ms for S6 and 46 ms for S1 (saccade onset at t = 0 ms). These data show that the vergence step of the ambiguous stimulus condition is less convergent than the vergence step of the unambiguous stimulus condition for both subjects
Fig. 7
Fig. 7
a Vergence (mean and SE selected as described in Sect. 2.4) relative to predicted vergence based on the disparity cue (0 on vertical axis) from leftward saccade trials (bottom) and rightward saccade trials (top). Note that (1) there are some large individual biases, (2) that the ambiguous condition (purple triangle) is consistently less convergent than the unambiguous condition (cyan square), supporting the predictions based on slant cues. b Vergence (mean and SE) relative to unambiguous condition. On the right side of these graphs the mean of all subjects is shown. The systematic trend visible between and across subjects is significant for the whole group (leftward saccades: F = 13.04, P < 0.05 and rightward: F = 62.89, P < 0.001). All significant differences are denoted by a star (values are stated in text)
Fig. 8
Fig. 8
Perception and vergence are based on separate processing streams. Both monocular cues (such as relative motion, linear perspective, blur and looming) and binocular cues [such as horizontal disparity (global and local) and global vertical disparity] are used for perception as well as for vergence. The weights assigned to the individual cues might be different when used for perception than when used for vergence, resulting in different outcomes. In the present study, for example, the ambiguous stimulus yields a bistable perception of surface slant, whereas it yields a stable vergence angle. Cognitive factors, such as voluntary control, do not seem to exert influence on vergence, but they do influence perception

References

    1. Allison RS, Howard IP, Rogers BJ, Bridge H (1998) Temporal aspects of slant and inclination perception. Perception 27(11):1287–1304 - DOI - PubMed
    1. Banks MS, Hooge IT, Backus BT (2001) Perceiving slant about a horizontal axis from stereopsis. J Vis 1(2):55–79 - DOI - PubMed
    1. Bernardis P, Knox P, Bruno N (2005) How does action resist visual illusion? Uncorrected oculomotor information does not account for accurate pointing in peripersonal space. Exp Brain Res 162(2):133–144 - DOI - PubMed
    1. Both MH, van Ee R, Erkelens CJ (2003) Perceived slant from Werner’s illusion affects binocular saccadic eye movements. J Vis 3(11):685–697 - PubMed
    1. Bruno N (2001) When does action resist visual illusions? Trends Cogn Sci 5(9):379–382 - DOI - PubMed

Publication types

LinkOut - more resources