

Photophysical properties of acene DCDHF fluorophores: long-wavelength single-molecule emitters designed for cellular imaging
- PMID: 17718454
- PMCID: PMC2678804
- DOI: 10.1021/jp0712598
Photophysical properties of acene DCDHF fluorophores: long-wavelength single-molecule emitters designed for cellular imaging
Abstract
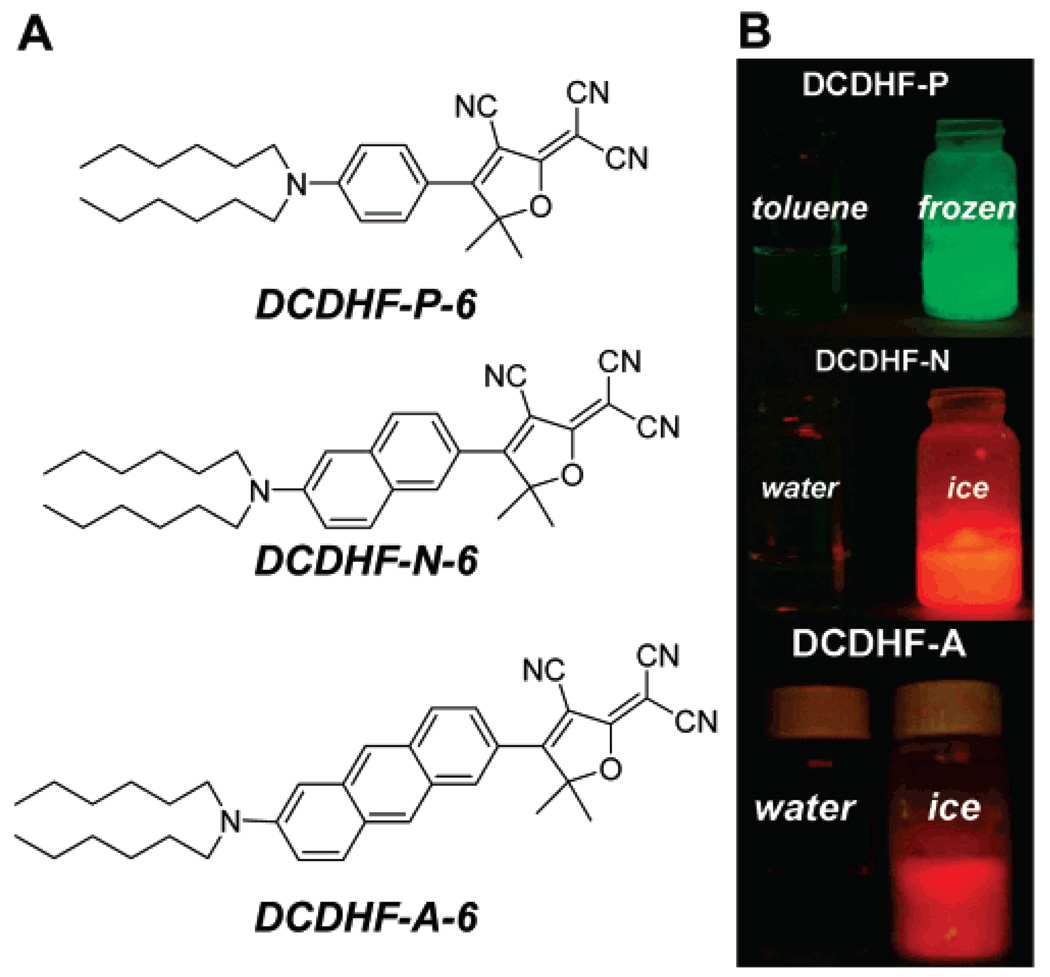
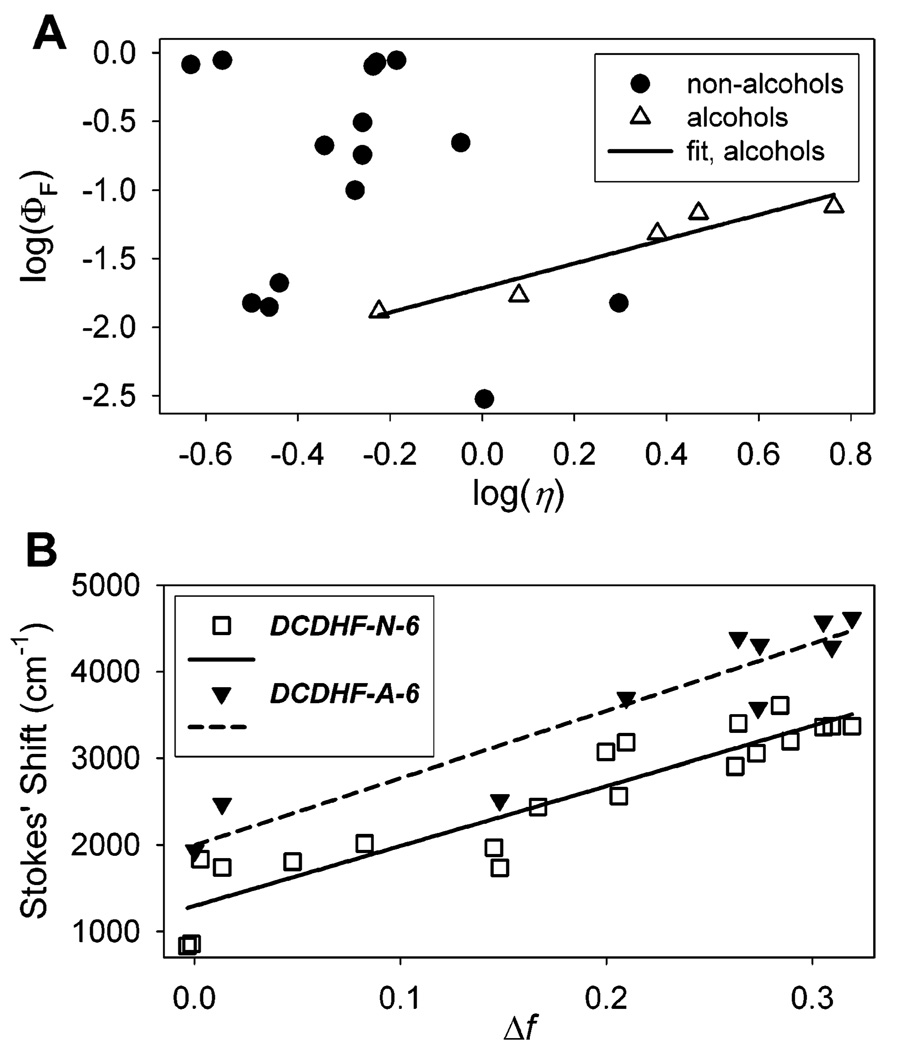
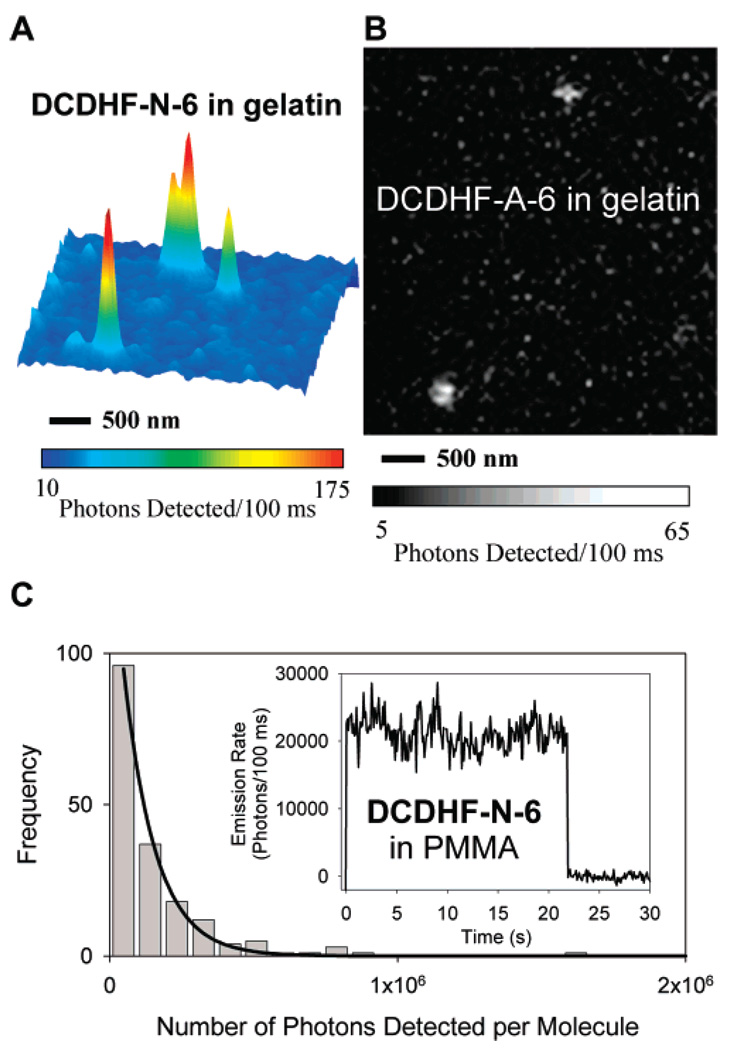
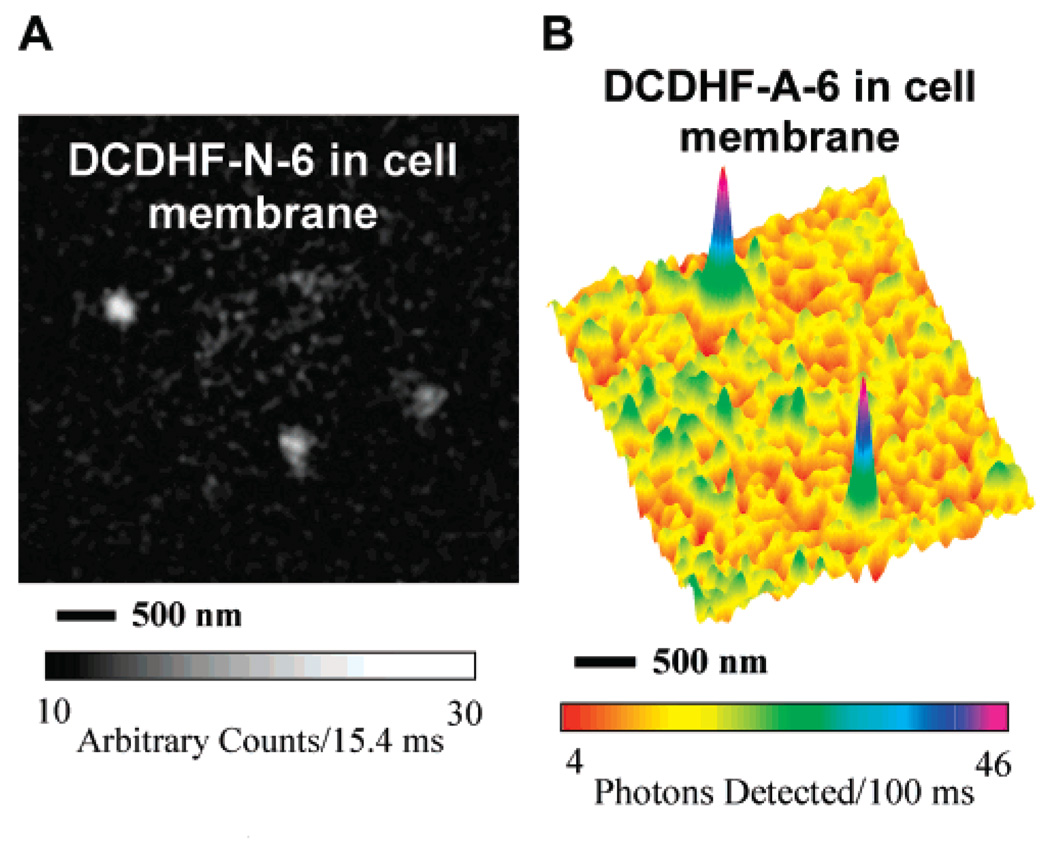
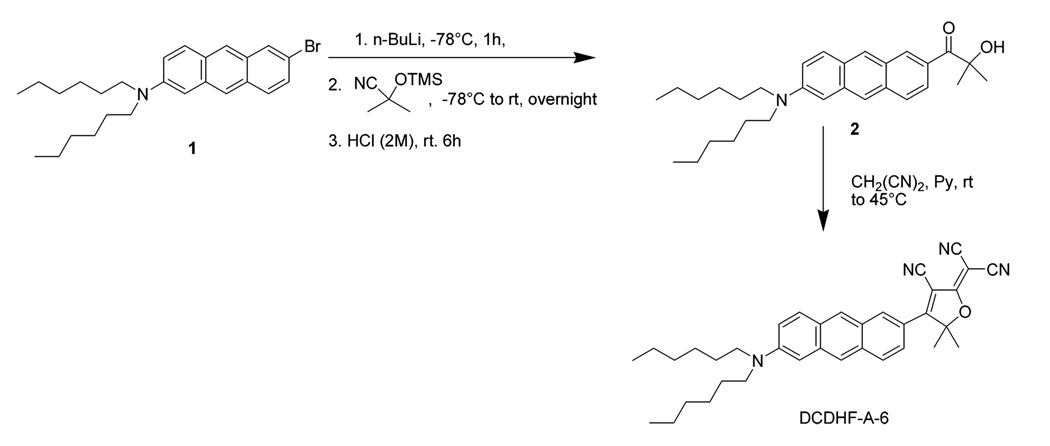
We report the solvatochromic, viscosity-sensitive, and single-molecule photophysics of the fluorophores DCDHF-N-6 and DCDHF-A-6. These molecules are members of the dicyanomethylenedihydrofuran (DCDHF) class of single-molecule emitters that contain an amine electron donor and a DCDHF acceptor linked by a conjugated unit; DCDHF-N-6 and DCDHF-A-6 have naphthalene- and anthracene-conjugated linkers, respectively. These molecules maintain the beneficial photophysics of the phenylene-linked DCDHF (i.e., photostability, emission wavelength dependence on solvent polarity, and quantum yield sensitivity to solvent viscosity), yet offer absorption and emission at longer wavelengths that are more appropriate for cellular imaging. We demonstrate that these new fluorophores are less photolabile in an aqueous environment than several other commonly used dyes (rhodamine 6G, Texas Red, and fluorescein). Finally, we image single copies of the acene DCDHFs diffusing in the plasma membrane of living cells.
Figures

Similar articles
-
Bright, Red Single-Molecule Emitters: Synthesis and Properties of Environmentally Sensitive Dicyanomethylenedihydrofuran (DCDHF) Fluorophores with Bisaromatic Conjugation.Chem Mater. 2009 Feb 5;21(5):797. doi: 10.1021/cm801783f. Chem Mater. 2009. PMID: 20140061 Free PMC article.
-
Diffusion of lipid-like single-molecule fluorophores in the cell membrane.J Phys Chem B. 2006 Apr 20;110(15):8151-7. doi: 10.1021/jp0574145. J Phys Chem B. 2006. PMID: 16610918 Free PMC article.
-
DCDHF fluorophores for single-molecule imaging in cells.Chemphyschem. 2009 Jan 12;10(1):55-65. doi: 10.1002/cphc.200800581. Chemphyschem. 2009. PMID: 19025732 Free PMC article. Review.
-
Alkoxy-styryl DCDHF fluorophores.Phys Chem Chem Phys. 2010 Jul 28;12(28):7768-71. doi: 10.1039/c003752b. Epub 2010 May 17. Phys Chem Chem Phys. 2010. PMID: 20473439
-
Nonlinear optical chromophores as nanoscale emitters for single-molecule spectroscopy.Acc Chem Res. 2005 Jul;38(7):549-56. doi: 10.1021/ar0401294. Acc Chem Res. 2005. PMID: 16028889 Review.
Cited by
-
Unique Photophysical Behavior of Coumarin-Based Viscosity Probes during Molecular Self-Assembly.ACS Omega. 2019 Mar 4;4(3):4785-4792. doi: 10.1021/acsomega.8b02357. eCollection 2019 Mar 31. ACS Omega. 2019. PMID: 31459662 Free PMC article.
-
Push-pull dioxaborine as fluorescent molecular rotor: far-red fluorogenic probe for ligand-receptor interactions.J Mater Chem C Mater. 2016 Apr 14;4(14):3002-3009. doi: 10.1039/C5TC03411F. Epub 2015 Dec 7. J Mater Chem C Mater. 2016. PMID: 28491320 Free PMC article.
-
Ultrafast Transient Absorption Spectra of Photoexcited YOYO-1 molecules call for additional investigations of their fluorescence quenching mechanism.J Photochem Photobiol A Chem. 2018 Dec 1;367:411-419. doi: 10.1016/j.jphotochem.2018.09.012. Epub 2018 Sep 10. J Photochem Photobiol A Chem. 2018. PMID: 30410276 Free PMC article.
-
Azido push-pull fluorogens photoactivate to produce bright fluorescent labels.J Phys Chem B. 2010 Nov 18;114(45):14157-67. doi: 10.1021/jp907080r. Epub 2009 Oct 27. J Phys Chem B. 2010. PMID: 19860443 Free PMC article.
-
Bright, Red Single-Molecule Emitters: Synthesis and Properties of Environmentally Sensitive Dicyanomethylenedihydrofuran (DCDHF) Fluorophores with Bisaromatic Conjugation.Chem Mater. 2009 Feb 5;21(5):797. doi: 10.1021/cm801783f. Chem Mater. 2009. PMID: 20140061 Free PMC article.
References
-
- Sako Y, Yanagida T. Review: Single-Molecule Visualization in Cell Biology. Nat. ReV. Mol. Cell Biol. 2003;4:SS1–SS5. - PubMed
-
- Moerner WE. Optical Measurements of Single Molecules in Cells. TrAC, Trends Anal. Chem. 2003;22:544–548.
-
- Tinnefeld P, Sauer M. Branching Out of Single-Molecule Fluorescence Spectroscopy: Challenges for Chemistry and Influence on Biology. Angew. Chem., Int. Ed. 2005;44:2642–2671. - PubMed
Publication types
MeSH terms
Substances
Grants and funding
LinkOut - more resources
Full Text Sources
Other Literature Sources
