Genomic and proteomic profiling II: comparative assessment of gene expression profiles in leiomyomas, keloids, and surgically-induced scars
- PMID: 17718906
- PMCID: PMC2039739
- DOI: 10.1186/1477-7827-5-35
Genomic and proteomic profiling II: comparative assessment of gene expression profiles in leiomyomas, keloids, and surgically-induced scars
Abstract
Background: Leiomyoma have often been compared to keloids because of their fibrotic characteristic and higher rate of occurrence among African Americans as compared to other ethnic groups. To evaluate such a correlation at molecular level this study comparatively analyzed leiomyomas with keloids, surgical scars and peritoneal adhesions to identify genes that are either commonly and/or individually distinguish these fibrotic disorders despite differences in the nature of their development and growth.
Methods: Microarray gene expression profiling and realtime PCR.
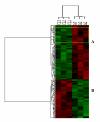
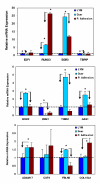
Results: The analysis identified 3 to 12% of the genes on the arrays as differentially expressed among these tissues based on P ranking at greater than or equal to 0.005 followed by 2-fold cutoff change selection. Of these genes about 400 genes were identified as differentially expressed in leiomyomas as compared to keloids/incisional scars, and 85 genes as compared to peritoneal adhesions (greater than or equal to 0.01). Functional analysis indicated that the majority of these genes serve as regulators of cell growth (cell cycle/apoptosis), tissue turnover, transcription factors and signal transduction. Of these genes the expression of E2F1, RUNX3, EGR3, TBPIP, ECM-2, ESM1, THBS1, GAS1, ADAM17, CST6, FBLN5, and COL18A was confirmed in these tissues using quantitative realtime PCR based on low-density arrays.
Conclusion: the results indicated that the molecular feature of leiomyomas is comparable but may be under different tissue-specific regulatory control to those of keloids and differ at the levels rather than tissue-specific expression of selected number of genes functionally regulating cell growth and apoptosis, inflammation, angiogenesis and tissue turnover.
Figures


Similar articles
-
Keloids, hypertrophic scars, and uterine fibroid development: a prospective ultrasound study of Black and African American women.F S Sci. 2023 May;4(2):172-180. doi: 10.1016/j.xfss.2023.03.006. Epub 2023 Apr 5. F S Sci. 2023. PMID: 37028513 Free PMC article.
-
Genomic and proteomic profiling I: leiomyomas in African Americans and Caucasians.Reprod Biol Endocrinol. 2007 Aug 23;5:34. doi: 10.1186/1477-7827-5-34. Reprod Biol Endocrinol. 2007. PMID: 17716379 Free PMC article.
-
Reduced dermatopontin expression is a molecular link between uterine leiomyomas and keloids.Genes Chromosomes Cancer. 2004 Jul;40(3):204-17. doi: 10.1002/gcc.20035. Genes Chromosomes Cancer. 2004. PMID: 15139000 Free PMC article.
-
A new hypothesis about the origin of uterine fibroids based on gene expression profiling with microarrays.Am J Obstet Gynecol. 2006 Aug;195(2):415-20. doi: 10.1016/j.ajog.2005.12.059. Epub 2006 Apr 25. Am J Obstet Gynecol. 2006. PMID: 16635466 Free PMC article. Review.
-
Keloid and Hypertrophic Scars Are the Result of Chronic Inflammation in the Reticular Dermis.Int J Mol Sci. 2017 Mar 10;18(3):606. doi: 10.3390/ijms18030606. Int J Mol Sci. 2017. PMID: 28287424 Free PMC article. Review.
Cited by
-
Molecular characterisation of the tumour microenvironment in breast cancer.Eur J Cancer. 2008 Dec;44(18):2760-5. doi: 10.1016/j.ejca.2008.09.038. Epub 2008 Nov 19. Eur J Cancer. 2008. PMID: 19026532 Free PMC article. Review.
-
Differential Expression of Super-Enhancer-Associated Long Non-coding RNAs in Uterine Leiomyomas.Reprod Sci. 2022 Oct;29(10):2960-2976. doi: 10.1007/s43032-022-00981-4. Epub 2022 May 31. Reprod Sci. 2022. PMID: 35641855 Free PMC article.
-
The expression and potential regulatory function of microRNAs in the pathogenesis of leiomyoma.Semin Reprod Med. 2008 Nov;26(6):500-14. doi: 10.1055/s-0028-1096130. Epub 2008 Oct 24. Semin Reprod Med. 2008. PMID: 18951332 Free PMC article. Review.
-
Keloids, hypertrophic scars, and uterine fibroid development: a prospective ultrasound study of Black and African American women.F S Sci. 2023 May;4(2):172-180. doi: 10.1016/j.xfss.2023.03.006. Epub 2023 Apr 5. F S Sci. 2023. PMID: 37028513 Free PMC article.
-
The Causal Role of Uterine Fibroid in Keloid and Hypertrophic Scar: A Bidirectional Mendelian Randomization Study on European Populations.Curr Pharm Biotechnol. 2025;26(5):754-768. doi: 10.2174/0113892010326633240911062613. Curr Pharm Biotechnol. 2025. PMID: 39318216
References
Publication types
MeSH terms
Substances
Grants and funding
LinkOut - more resources
Full Text Sources
Medical
Research Materials
Miscellaneous

