. 2007 Aug 24:2:15.
doi: 10.1186/1750-1326-2-15.

An AICD-based functional screen to identify APP metabolism regulators

Affiliations

An AICD-based functional screen to identify APP metabolism regulators

Can Zhang et al. Mol Neurodegener. .

Abstract

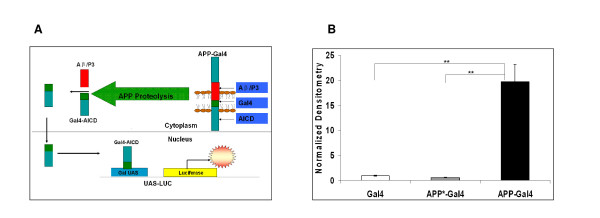
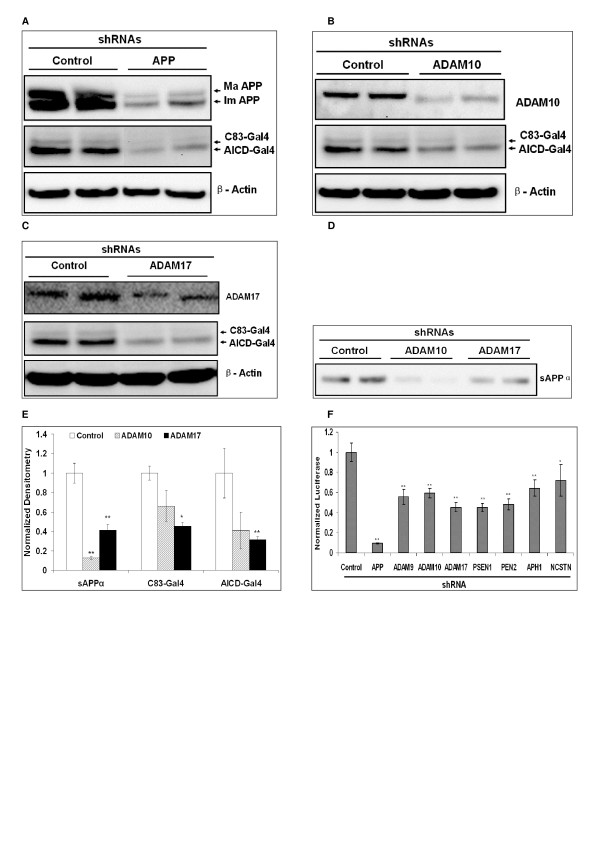
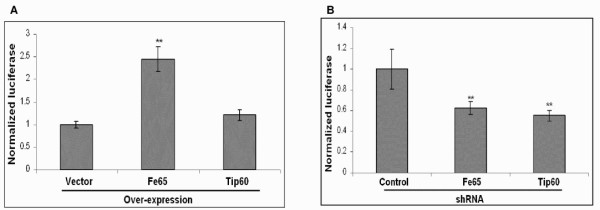
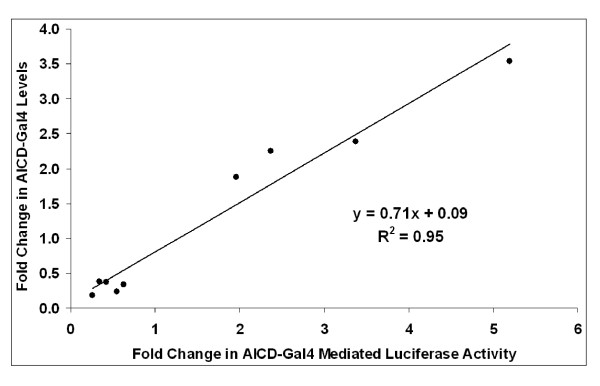
Background: A central event in Alzheimer's disease (AD) is the regulated intramembraneous proteolysis of the beta-amyloid precursor protein (APP), to generate the beta-amyloid (Abeta) peptide and the APP intracellular domain (AICD). Abeta is the major component of amyloid plaques and AICD displays transcriptional activation properties. We have taken advantage of AICD transactivation properties to develop a genetic screen to identify regulators of APP metabolism. This screen relies on an APP-Gal4 fusion protein, which upon normal proteolysis, produces AICD-Gal4. Production of AICD-Gal4 induces Gal4-UAS driven luciferase expression. Therefore, when regulators of APP metabolism are modulated, luciferase expression is altered.

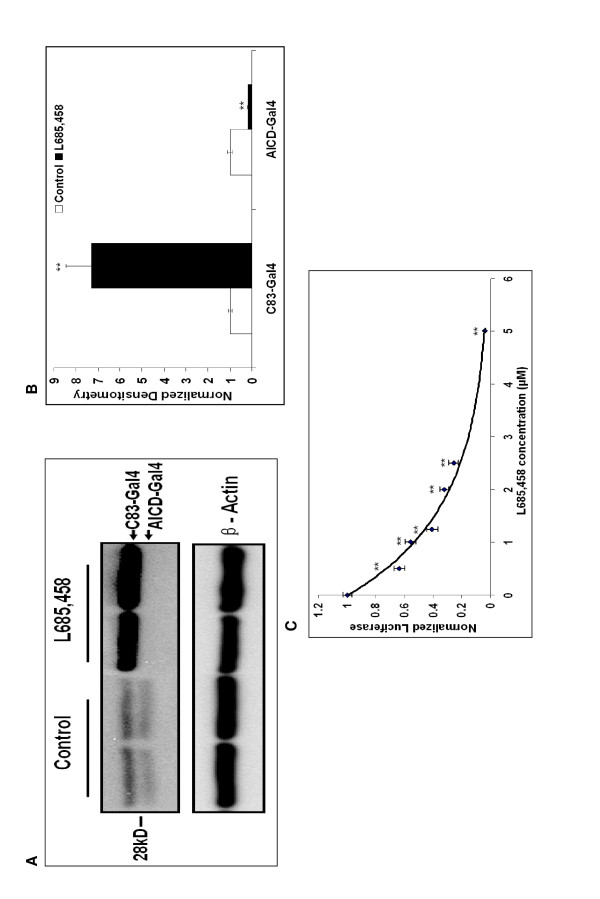
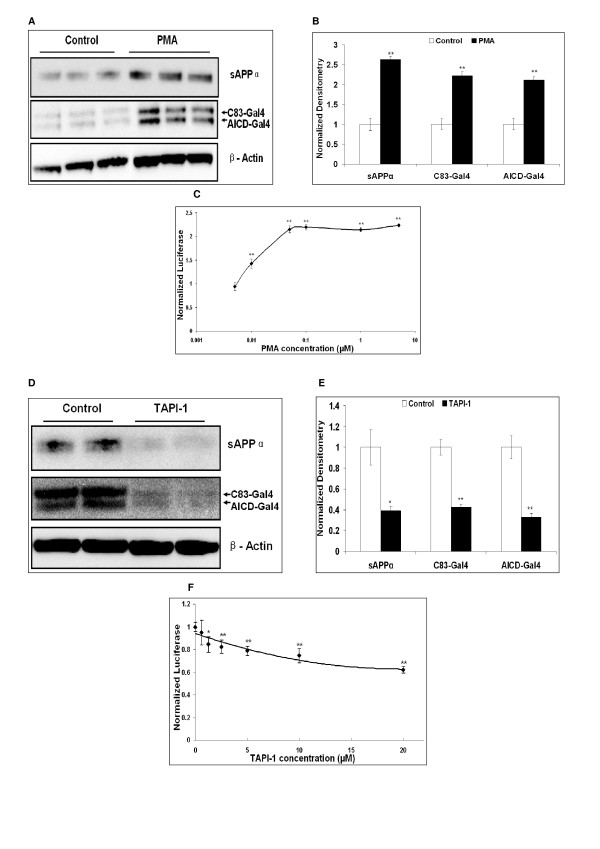
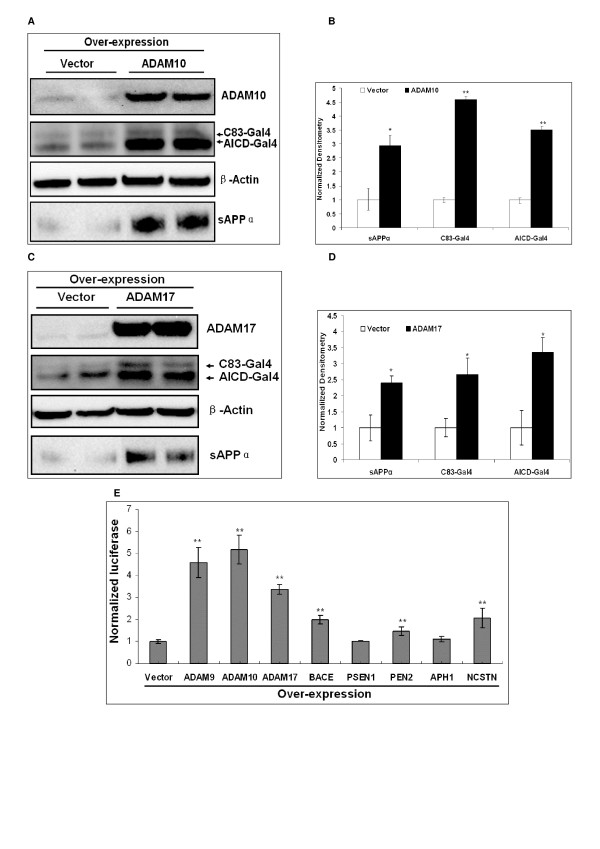
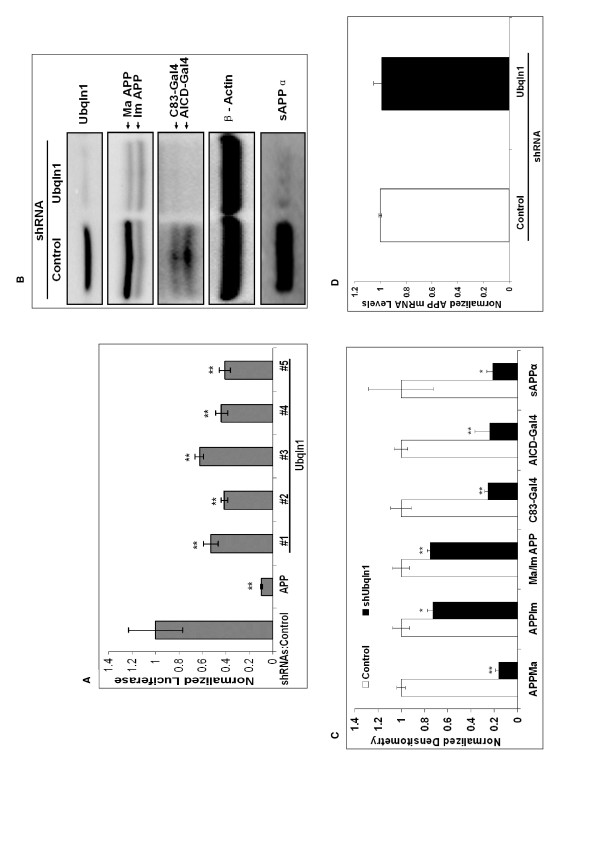
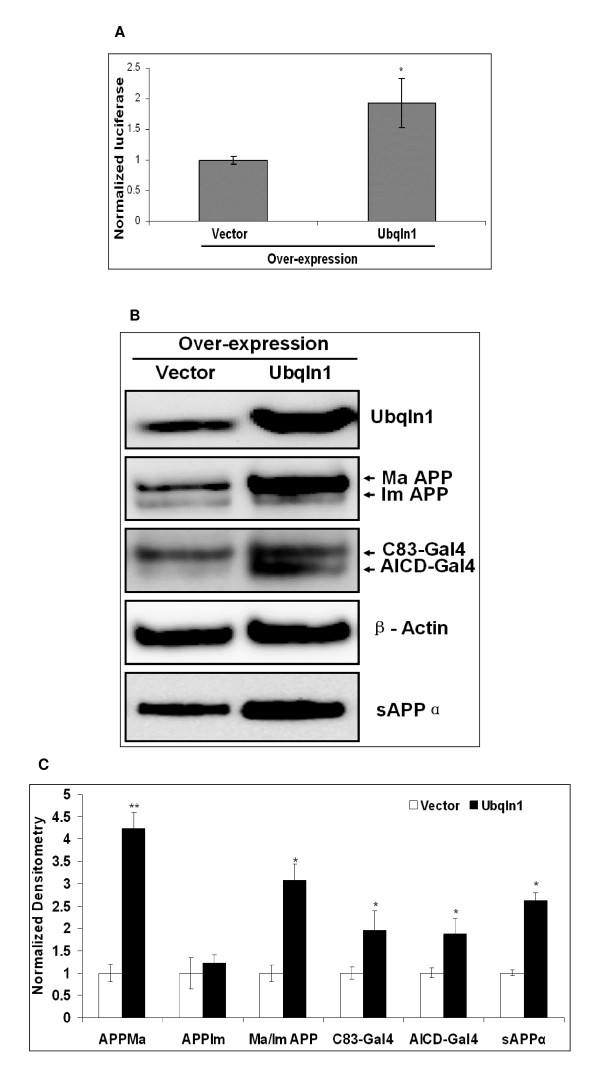
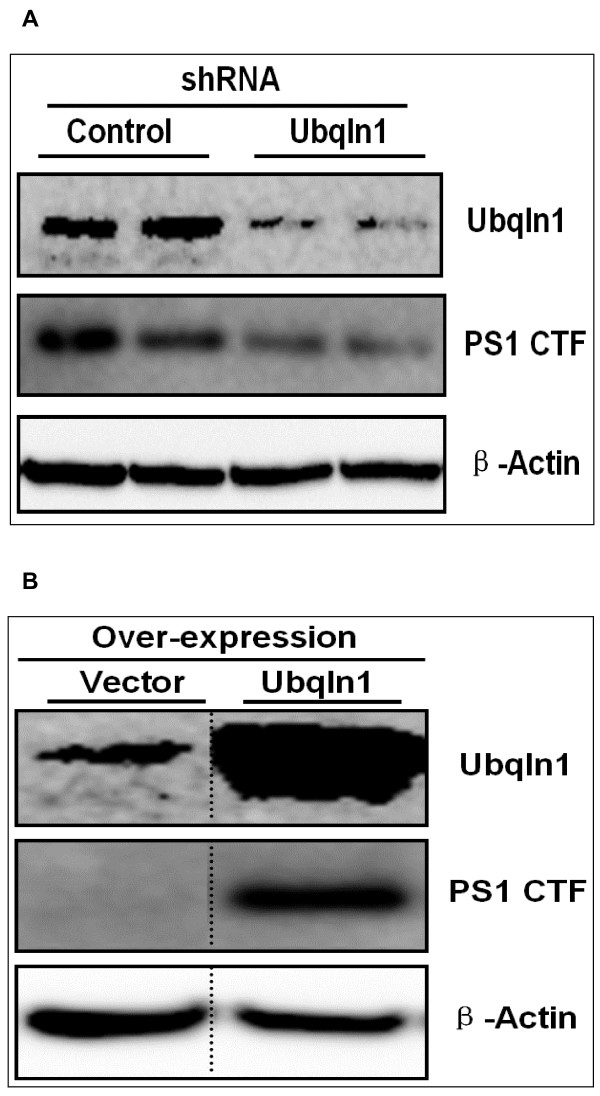
Results: To validate this experimental approach we modulated alpha-, beta-, and gamma-secretase levels and activities. Changes in AICD-Gal4 levels as measured by Western blot analysis were strongly and significantly correlated to the observed changes in AICD-Gal4 mediated luciferase activity. To determine if a known regulator of APP trafficking/maturation and Presenilin1 endoproteolysis could be detected using the AICD-Gal4 mediated luciferase assay, we knocked-down Ubiquilin 1 and observed decreased luciferase activity. We confirmed that Ubiquilin 1 modulated AICD-Gal4 levels by Western blot analysis and also observed that Ubiquilin 1 modulated total APP levels, the ratio of mature to immature APP, as well as PS1 endoproteolysis.

Conclusion: Taken together, we have shown that this screen can identify known APP metabolism regulators that control proteolysis, intracellular trafficking, maturation and levels of APP and its proteolytic products. We demonstrate for the first time that Ubiquilin 1 regulates APP metabolism in the human neuroblastoma cell line, SH-SY5Y.


Figures

Figure 1
Figure 1
Functional screen for regulators of APP metabolism. (A) Model depicting APP-Gal4 reporter system. (B) Firefly luciferase activity is significantly increased in SH-SY5Y cells stably expressing APP-Gal4 and Gal4-UAS Luciferase compared to SY5Y cells stably expressing either Gal4/Gal4-UAS Luciferase or APP*-Gal4/Gal4-UAS Luciferase. Luciferase activity was normalized to total cell number using SYBR Green. Bars represent mean normalized luciferase expression (+/- std. error) of 16 independent trials for each cell line. Student's t-tests with sequential Bonferroni correction for multiple comparisons; ** indicates p < 0.01.
Figure 2
Figure 2
γ-secretase inhibition decreases AICD-Gal4 levels and AICD-Gal4 mediated luciferase activity in SY5Y-APP-Gal4 cells. (A) Inhibition of γ-secretase by L-685,458 (5 mM) decreases AICD-Gal4 levels and increases C83-Gal4 levels as detected by Western blot analysis. (B) Quantification of Western blot densitometry in panel A. Normalization for loading differences was achieved by dividing the densitometry values for individual bands by the densitometry values for β-actin in the same lane. (C) Dose-dependent decreases in AICD-Gal4-mediated luciferase activity with increasing concentrations of L-685,458. For the luciferase experiments, points represent mean normalized luciferase activity (+/- standard error) of three independent trials, with luciferase levels normalized to total cell numbers using SYBR Green. Student's t-tests with sequential Bonferroni correction for multiple comparisons was utilized to test for significance. * indicates p < 0.05; ** indicates p < 0.01. "Control" uses the same media as the treatments, and also contains the same amount of DMSO.
Figure 3
Figure 3
Pharmacological modulation of α-secretase activity alters AICD-Gal4 levels and AICD-Gal4 mediated luciferase activity in SY5Y-APP-Gal4 cells. (A) Stimulation of α-secretase by PMA (1 μM PMA for 10 hours) increases sAPPα, C83-Gal4, and AICD-Gal4 levels as detected by Western blot analysis. (B) Quantification of Western blot densitometry in panel A. Normalization for loading differences was achieved by dividing the densitometry values for individual bands by the densitometry values for β-actin in the same lane. (C) Dose-dependent increases of AICD-Gal4-mediated luciferase activity with increasing concentrations of PMA (10 hour incubation). Luciferase levels normalized to total cell number using protein concentration. (D) Inhibition of α-secretases by TAPI-1 (20 μM for two hours) results in decreases in sAPPα, C83-Gal4, and AICD-Gal4 levels as detected by Western blot analysis. (E) Quantification of Western blot densitometry in panel D and normalized β-actin levels in the same lane. (F) Dose-dependent decreases in AICD-Gal4-mediated luciferase activity with increasing TAPI-1concentrations (two hour incubation). For the luciferase experiments, points represent mean normalized luciferase activity (+/- standard error) of three independent trials, with luciferase levels normalized to total cell numbers using SYBR Green. Student's t-tests with sequential Bonferroni correction for multiple comparisons; * indicates p < 0.05; ** indicates p < 0.01. "Control" uses the same media as the treatments and contains the same amount of DMSO as drug treated cells.
Figure 4
Figure 4
Over-expression of individual secretase genes in SY5Y-APP-Gal4 cells increases AICD-Gal4 mediated luciferase activity. (A) Transient over-expression of ADAM10 increases ADAM10, AICD-Gal4, C83-Gal4, and sAPPα levels compared to cells transfected with empty vector. (B) Quantification of Western blot densitometry in panel A. (C) ADAM17 transient over-expression significantly increases ADAM17, AICD-Gal4, C83-Gal4, and sAPPα levels. (D) Quantification of Western blot densitometry in panel C. (E) Transient over-expression of individual secretase genes increases AICD-Gal4 mediated luciferase activity. Luciferase was normalized to transfection efficiency, by dividing by Renilla luciferase activity. Individual secretase over-expression plasmids were co-transfected with pRL-SV40 plasmid, expressing Renilla luciferase. Bars represent the mean normalized luciferase activity of four independent trials and error bars represent standard errors. Statistical significance was determined using two-sample, one-tail t-tests to compare each secretase gene with the empty vector, followed by sequential Bonferroni procedure to adjust for multiple comparisons. * indicates p < 0.05; ** indicates p < 0.01.
Figure 5
Figure 5
Knock-down of APP and individual secretase genes in SY5Y-APP-GAL4 cells decreases AICD-Gal4 mediated luciferase activity. (A) APP-specific shRNA decreases full-length APP, C83-Gal4, and AICD-Gal4 levels compared to the control or "non-silencing" shRNA. Results from duplicate transfections with each shRNA are shown. (B) ADAM10 specific shRNAs decrease endogenous ADAM10, C83-Gal4, and AICD-Gal4 levels compared to the control shRNA. Results from duplicate transfections with each shRNA are shown. (C) ADAM17 specific shRNAs decrease endogenous ADAM17, C83-Gal4, and AICD-Gal4 levels compared to the control shRNA. Results from duplicate transfections with each shRNA are shown. (D) Knock-down of ADAM9, 10, and 17 decrease sAPPα levels compared to control shRNA. (E) Quantification of Western blot densitometries in panels B – D. (F) Transfection with shRNAs specific for APP and individual secretase genes decreases AICD-Gal4-mediated luciferase expression compared to control shRNA. Bars represent the mean normalized luciferase activity of four independent trials and error bars represent standard errors. Statistical significance was determined using two-sample, one tailed t-tests to compare each secretase shRNA with the control shRNA and sequential Bonferroni procedure to adjust for multiple comparisons. * indicates p < 0.05; ** indicates p < 0.01.
Figure 6
Figure 6
Genetic alteration of Fe65 or Tip60 levels modulates AICD-Gal4 mediated luciferase activity. (A) Transient over-expression of Tip60 or Fe65 in SY5Y-APP-Gal4 cells increases AICD-Gal4 production compared to empty vector controls. (B) Knock-down of Fe65 or Tip60 in SY5Y-APP-Gal4 cells decreases AICD-Gal4 mediated luciferase activity Bars represent the mean normalized luciferase activity of four independent trials and error bars represent standard errors. Statistical significance was determined using two-sample, one-tailed t-tests to compare each secretase gene and "vector" or "control" and sequential Bonferroni procedure to adjust for multiple comparisons. * indicates p < 0.05.
Figure 7
Figure 7
Ubiquilin 1 knock-down regulates APP-Gal4 metabolism in SY5Y-APP-Gal4 cells. (A) Ubiquilin 1 knock-down decreases AICD-Gal4-mediated luciferase activity. SY5Y-APP-Gal4 cells stably expressing the control shRNA, an APP specific shRNA, or five different shRNA targeting Ubiquilin 1 were generated. Cell lysates were utilized to measure AICD-Gal4 mediated luciferase activity. Bars represent the mean normalized luciferase activity (+/- standard error) of six independent trials. (B) SY5Y-APP-Gal4 cells stably expressing Ubiquilin 1 specific shRNA (#2) have decreased Ubiquilin 1, mature and immature APP-Gal4, C83-Gal4, AICD-Gal4, and sAPPα levels compared to cells expressing control shRNA. (C) Quantification of Western blot results. Bars represent mean densitometry (+/- standard error) of three independent trials. Black bars represent the densitometry from Ubiquilin 1 knock-down cells; white bars represent the densitometry from cells expressing control shRNA. Abbreviations: Ma APP denotes mature APP, Im APP denotes immature APP; Ma/Im APP denotes the mature APP/immature APP ratio. Statistical significance between mock and over-expression for each measure was determined using a two-sample, one tailed t-test and sequential Bonferroni procedure to adjust for multiple comparisons. * indicates p < 0.05; ** indicates p < 0.01. (D) Ubiquilin 1 knock-down does not alter APP mRNA levels compared to control shRNA as measured by quantitative PCR.
Figure 8
Figure 8
Ubiquilin 1 over-expression regulates APP-Gal4 metabolism in SY5Y-APP-Gal4 cells. (A) Transient Ubiquilin 1 over-expression increases AICD-Gal4 mediated luciferase activity. SY5Y-APP-GAL4 cells were transiently co-transfected with UBQLN1 over-expression plasmid and a Renilla luciferase over-expression plasmid (pRL-SV40). The latter was used as a transfection efficiency control to normalize AICD-Gal4 mediated luciferase activity. Bars represent the mean normalized luciferase activity (+/- standard error) of six independent trials. Statistical significance was determined using two-sample, one-tailed t-tests to compare each experimental shRNA to the control shRNA and sequential Bonferroni procedure to adjust for multiple comparisons. (B) SY5Y-APP-Gal4 cells transiently over-expressing Ubiquilin 1 have increased Ubiquilin 1, mature and immature APP-Gal4, C83-Gal4, AICD-Gal4, and sAPPα levels compared to vector only cells. (C) Quantification of Western blot results. Bars represent mean densitometry (+/- standard error) of three independent trials. Black bars represent the densitometry from Ubiquilin 1 over-expressing cells; white bars represent the densitometry from cells expressing empty vector control. Abbreviations: Ma APP denotes mature APP, Im APP denotes immature APP; Ma/Im APP denotes the mature APP/immature APP ratio. Statistical significance between mock and over-expression for each measure was determined using a two-sample, one tailed t-test and sequential Bonferroni procedure to adjust for multiple comparisons. * indicates p < 0.05; ** indicates p < 0.01.
Figure 9
Figure 9
Ubiquilin 1 regulates Presenilin 1 endoproteolysis in SY5Y-APP-Gal4 cells.(A) Ubiquilin 1 knock-down decreases PS1 CTF levels in SY5Y-APP-Gal4 cells. (B) Ubiquilin 1 over-expression increases PS1 CTF levels in SY5Y-APP-Gal4 cells.
Figure 10
Figure 10
Correlation between AICD-Gal4 mediated luciferase levels and AICD-Gal4 levels determined by Western blot analysis. Using data from pharmacologic (PMA, TAPI-1, L-685,458), over-expression (ADAM 10, ADAM17, Ubiquilin 1) or knock-down (ADAM 10, ADAM17, Ubiquilin 1) mediated modulation of AICD-Gal4 levels we plotted the average fold change in AICD-Gal4 levels versus the average fold change in AICD-Gal4 mediated luciferase activity. For transient over-expression, luciferase activity and AICD-Gal4 levels were normalized to transfection efficiency by Renilla luciferase activity assays. The line is represents the least squares linear regression to this data.

Similar articles

Cited by

References

    1. Ebinu JO, Yankner BA. A RIP tide in neuronal signal transduction. Neuron. 2002;34:499–502. doi: 10.1016/S0896-6273(02)00704-3. - DOI - PubMed
    1. Urban S, Freeman M. Intramembrane proteolysis controls diverse signalling pathways throughout evolution. Curr Opin Genet Dev. 2002;12:512–8. doi: 10.1016/S0959-437X(02)00334-9. - DOI - PubMed
    1. Brown MS, Ye J, Rawson RB, Goldstein JL. Regulated intramembrane proteolysis: a control mechanism conserved from bacteria to humans. Cell. 2000;100:391–8. doi: 10.1016/S0092-8674(00)80675-3. - DOI - PubMed
    1. Annaert W, De Strooper B. A cell biological perspective on Alzheimer's disease. Annu Rev Cell Dev Biol. 2002;18:25–51. doi: 10.1146/annurev.cellbio.18.020402.142302. - DOI - PubMed
    1. Sisodia SS. Biomedicine. A cargo receptor mystery APParently solved? Science. 2002;295:805–7. doi: 10.1126/science.1069661. - DOI - PubMed

LinkOut - more resources