

Regional differences in African Americans' high risk for stroke: the remarkable burden of stroke for Southern African Americans
- PMID: 17719482
- PMCID: PMC1995237
- DOI: 10.1016/j.annepidem.2007.03.019
Regional differences in African Americans' high risk for stroke: the remarkable burden of stroke for Southern African Americans
Abstract
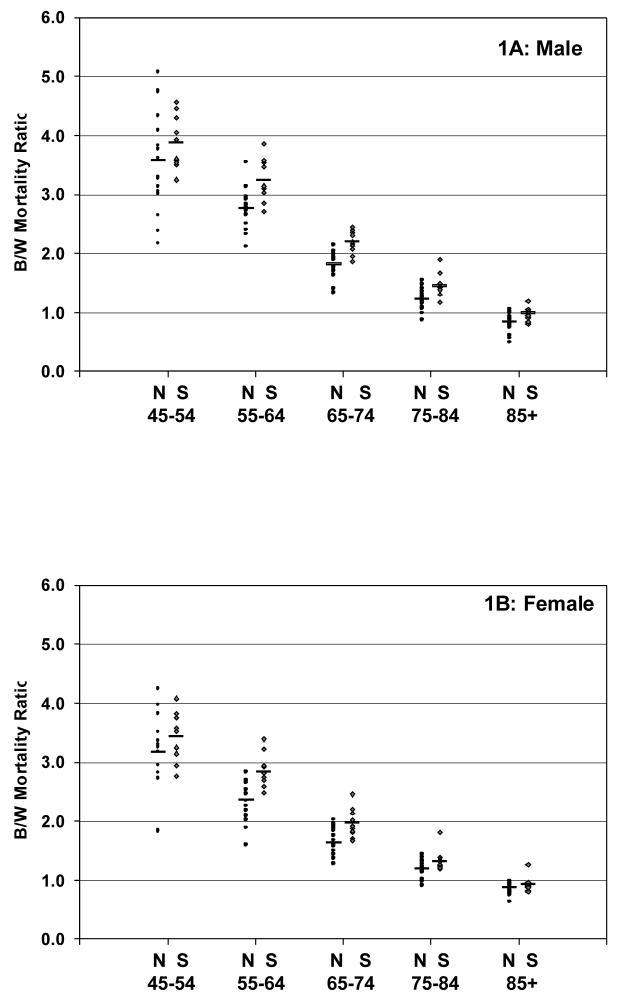
Purpose: The stroke mortality rate for African Americans aged 45 to 64 years is 3 to 4 times higher than for whites of the same age, with a decreasing black-to-white mortality ratio with increasing age. There is also a "STROKE BELT" with higher stroke mortality in the southeastern United States. This study assesses if there are also geographic variations in the magnitude of the excess stroke mortality for African Americans.
Methods: The age- and sex-specific black-to-white mortality ratio was calculated for each of 26 states with a sufficient African American population for stable estimates. The southern excess was calculated as the percentage excess of southern over nonsouthern rates.
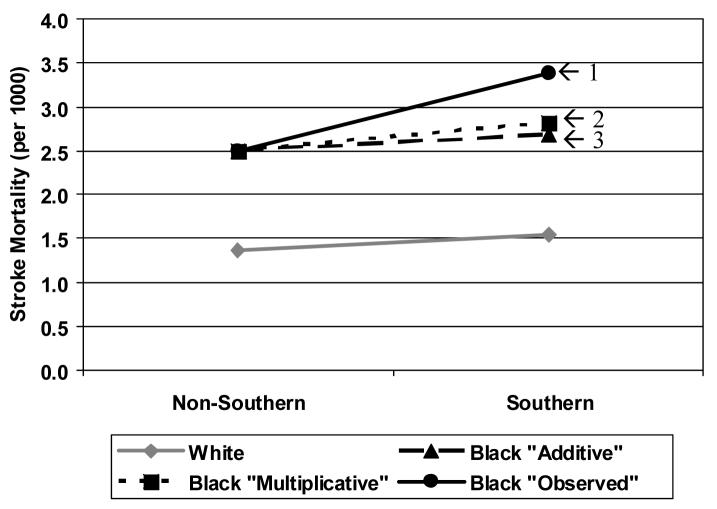
Results: Across age and sex strata, the black-to-white stroke mortality ratio was consistently higher for southern states, with an average black-to-white stroke mortality ratio that ranged from 6% to 21% higher among southern states than in nonsouthern states.
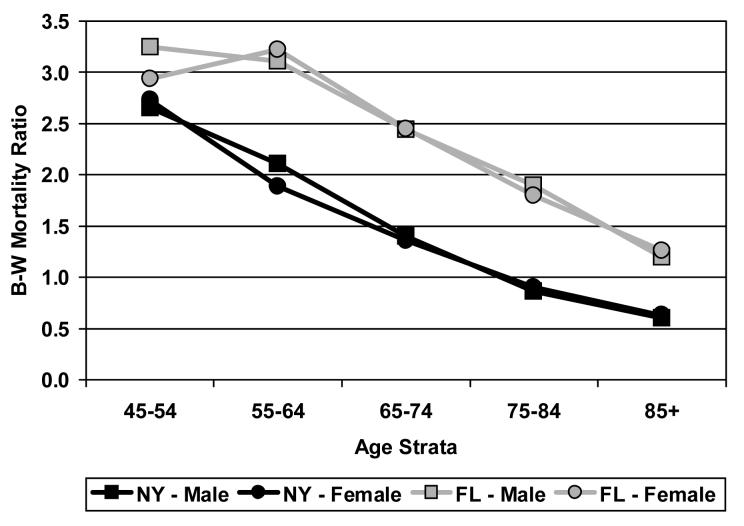
Conclusions: The increase in stroke mortality rates for African Americans in southern states is even larger than expected. That southern states that are not part of the "STROKE BELT" (Virginia and Florida) also have an elevated black-to-white mortality ratio suggests the mechanism of higher risk for African Americans may be independent of the causes contributing to "STROKE BELT."
Figures
References
-
- Lanska DJ. Geographic distribution of stroke mortality in the United States: 1939-1941 to 1979 to 1981. Neurology. 1993;43:1839–1851. - PubMed
-
- Casper ML, Wing S, Anda RF, Knowles M, Pollard RA. The shifting stroke belt: chances in the geographic pattern of stroke mortality in the United States, 1962 to 1988. Stroke. 1995;26:755–760. - PubMed
-
- Casper ML, Barnett E, Williams GI, Jr., Halverson JA, Braham VE, Greenlund KJ. Atlas of Stroke Mortality: Racial, Ethnic, and Geographic Disparities in the United States. Department of Health and Human Services, Centers for Disease Control and Prevention; Atlanta, GA: 2003.
-
- Howard G, Anderson R, Johnson NJ, Sorlie P, Russell G, Howard VJ. Evaluation of social status as a contributing factor to the stroke belt of the United States. Stroke. 1997;28:936–940. - PubMed
Publication types
MeSH terms
Grants and funding
LinkOut - more resources
Full Text Sources
Medical
