. 2007 Aug 24;130(4):730-741.
doi: 10.1016/j.cell.2007.06.045.

Intrinsic circadian clock of the mammalian retina: importance for retinal processing of visual information

Affiliations

Intrinsic circadian clock of the mammalian retina: importance for retinal processing of visual information

Kai-Florian Storch et al. Cell. .

Abstract

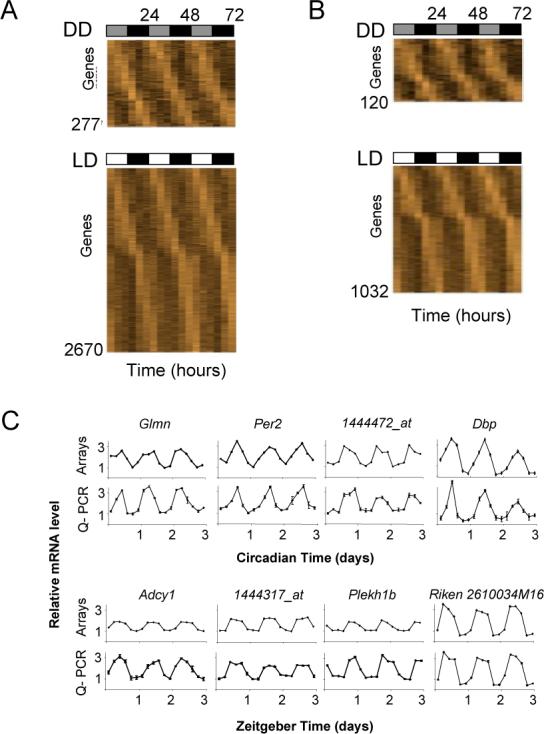
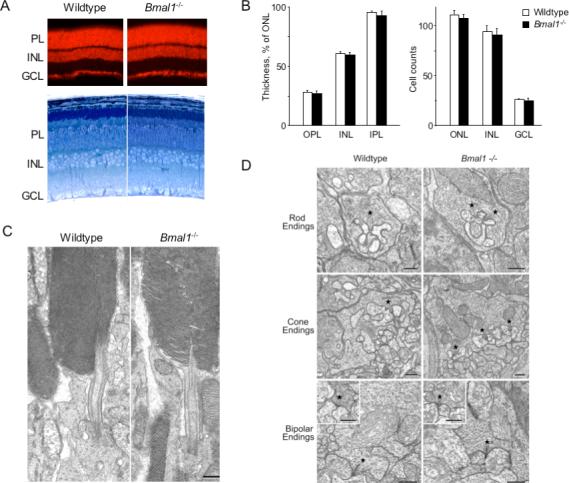
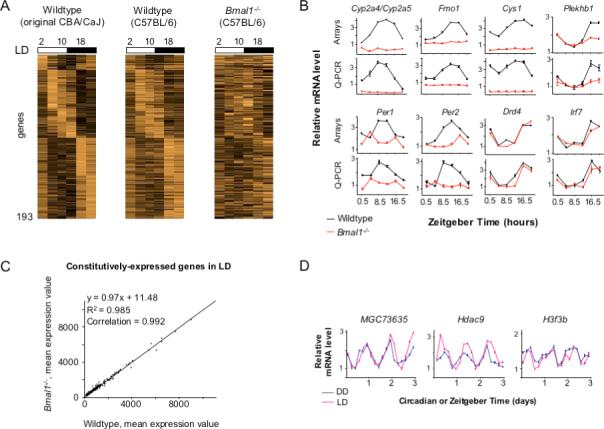
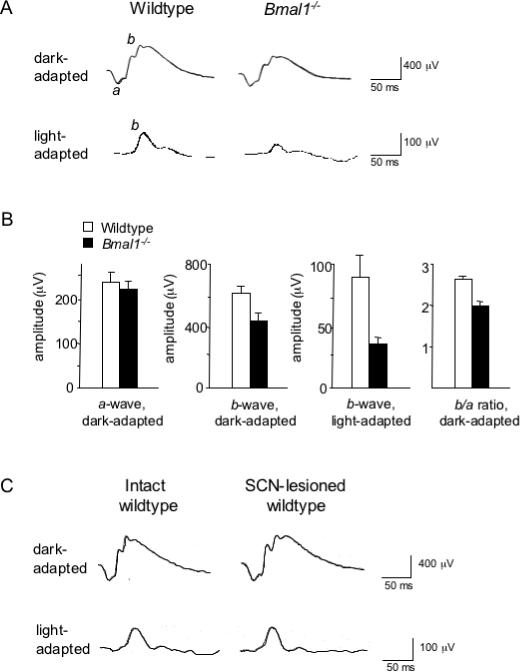
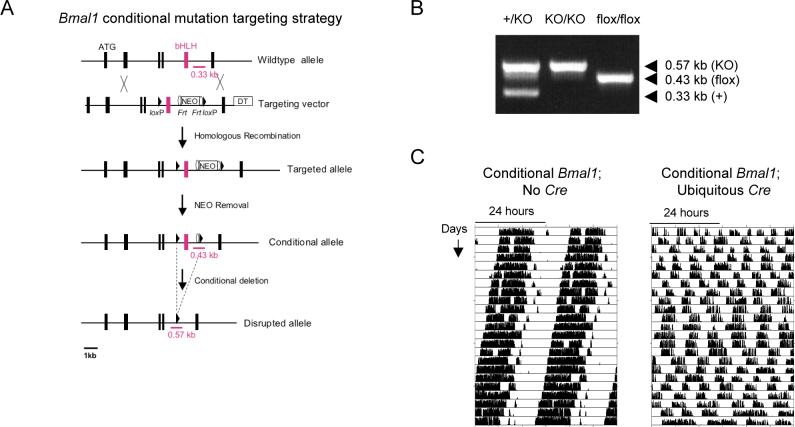
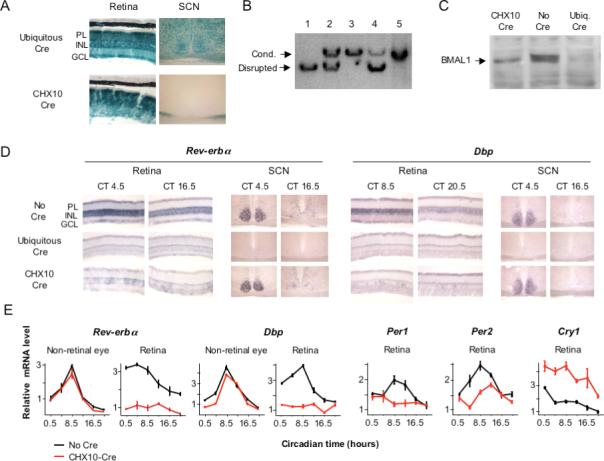
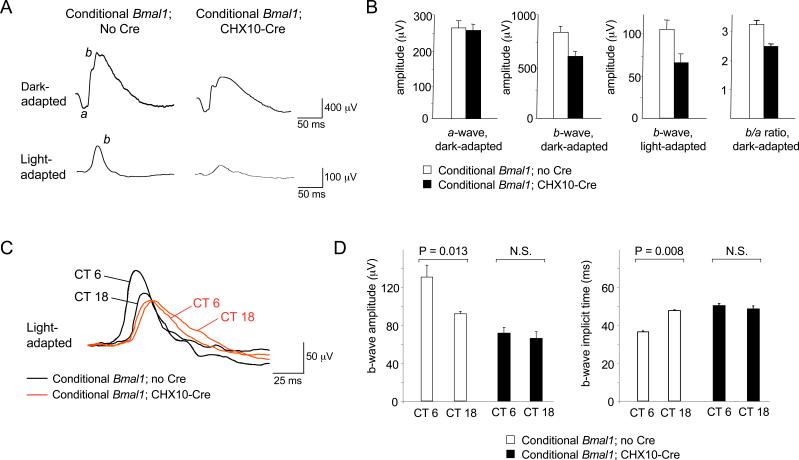
Circadian clocks are widely distributed in mammalian tissues, but little is known about the physiological functions of clocks outside the suprachiasmatic nucleus of the brain. The retina has an intrinsic circadian clock, but its importance for vision is unknown. Here we show that mice lacking Bmal1, a gene required for clock function, had abnormal retinal transcriptional responses to light and defective inner retinal electrical responses to light, but normal photoreceptor responses to light and retinas that appeared structurally normal by light and electron microscopy. We generated mice with a retina-specific genetic deletion of Bmal1, and they had defects of retinal visual physiology essentially identical to those of mice lacking Bmal1 in all tissues and lacked a circadian rhythm of inner retinal electrical responses to light. Our findings indicate that the intrinsic circadian clock of the retina regulates retinal visual processing in vivo.


Figures

Figure 1
Figure 1. Genes with 24-hour rhythms of expression in the mouse eye
(A, B) Three-day expression profiles in which each column represents a time-point and each row a gene, with genes ordered by phase of peak expression. Light shades represent expression values above the mean for a gene; dark shades below the mean. Total time in constant darkness (DD) or in a light-dark cycle (LD) is indicated at top, and the bars represent subjective day and night in DD or light and dark conditions in LD. The number of genes is indicated at the lower left. (A) Threshold: 15% false discovery rate. (B) Threshold: 5% false discovery rate. (C) Validation of microarray profiles by quantitative reverse-transcriptase PCR (Q-PCR). Top, DD. Bottom, LD. Shown are comparisons of individual profiles from microarrays (arrays) and Q-PCR from the same RNA samples. For Q-PCR, the mean (N = 3) and SEM are shown (some error bars cannot be seen at this scale). Relative expression levels are plotted in arbitrary linear units. Glmn, glomulin; Per2, Period 2, Dbp, D-site albumin promoter binding protein; Adcy 1, adenylate cyclase 1; Plekh1b, plekstrin-homology 1b.
Figure 2
Figure 2. Normal retinal architecture, cellular organization, and ultrastructure in Bmal1−/− mutant mice
(A) Top, fluorescence images of retina sections from adult littermate wildtype or Bmal1−/− mutant mice stained with ethidium bromide to show cell nuclei. Organization of nuclear layers was indistinguishable in the two genotypes. Bottom, thick plastic sections of retinas from adult littermate wildtype or Bmal1−/− mice stained with toluidine blue to show cell morphology and structure. No difference between genotypes was observed. PL, photoreceptor layer; INL, inner nuclear layer; GCL, ganglion cell layer. (B) Quantitative comparison of thickness (left) and cell densities (right) (mean and SEM; N = 3) of retinal layers (at mid-periphery) of adult wildtype and Bmal1−/− littermate mice (Experimental Procedures). Results for central retina were similar (data not shown). There were no significant differences between genotypes. OPL, outer plexiform layer; IPL, inner plexiform layer. Cell counts: for ONL, INL--per 5000-μm2 area; GCL--per 200-μm segment of retina. (C) Representative electron micrographs of rod photoreceptors from adult littermate wildtype or Bmal1−/− mice. No difference between genotypes was observed in the fine structure of outer and inner segments. (D) Representative electron micrographs from adult littermate wildtype or Bmal1−/− mice. No differences between genotypes were evident in the morphology of synaptic endings of rods, cones, rod bipolars, or cone bipolars (insets) or in the complement of synaptic vesicles or structure of ribbon synapses (asterisks). (C,D) Scale bars, 500 nm.
Figure 3
Figure 3. Deficient rhythmic gene expression in LD in the eyes of Bmal1−/− mice
(A) One-day temporal profiles comparing ocular gene expression in LD for wildtype CBA/CAJ mice (the mean of three days—Figure1) and wildtype and littermate Bmal1−/− mice (C57BL/6); labels as in Figure 1. The same genes are shown in all three profiles, genes are ordered by the phase of peak expression in wildtype CBA/CaJ mice (left), and the brightness scale for expression is the same in all profiles. (B) Validation of microarray profiles by Q-PCR. Shown are examples of genes in Bmal1−/− mice with flat, altered, or normal rhythmic expression in comparison with wildtype littermates (C57BL/6). Cyp2a4/5, cytochrome P450−2a4/5; Fmo1, flavin-containing monooxygenase-1; Cys1, cystin 1; Plekh1b, plekstrin-homology 1b; Per1, Period 1; Drd4, D4 dopamine receptor; Irf7, interferon regulatory factor 7. (C) No effect of Bmal1 deletion on mean expression of 3,047 constitutively-expressed genes in the eye in LD (see Experimental Procedures). Genes are plotted in order of increasing mean expression from the wildtype dataset. (D) Daily rhythms of ocular expression of chromatin remodeling genes detected by microarray (Figure 1). MGC73635, similar to histone 2a; Hdac9, histone deacetylase 9; H3f3b, H3 histone, family 3B. For (B-D), relative expression values are plotted in arbitrary linear units.
Figure 4
Figure 4. Defective retinal electrical activity in response to light in Bmal1−/− mice but not SCN-lesioned wildtype mice
(A) Electroretinogram (ERG) traces in response to a flash of light for adult wildtype and littermate Bmal1−/− mice under dark- and light-adapted conditions; a- and b-waves labeled on wildtype traces. (B) Quantification of ERG responses in wildtype and Bmal1−/− littermates. Shown are mean and SEM; N = 6 for each genotype. (C) Representative ERG responses of intact wildtype and SCN-lesioned wildtype mice (each N = 5). No significant differences between groups were found for a- or b-wave amplitudes. Mice were C57BL/6, and ERGs were performed between Zeitgeber Time 4 and 9; wildtype and mutant (or intact and SCN-lesioned) mice were studied in alternating order.
Figure 5
Figure 5. Conditional Bmal1 allele
(A) Targeting strategy and conditional disruption. Closed boxes, exons; ATG, translation start site; bHLH, exon encoding basic helix-loop-helix domain; NEO, neomycin resistance marker; DT, diphtheria toxin cassette; triangles, loxP sites; ovals, Frt sites; bars with kilobase (kb) markers, sites and sizes of PCR products diagnostic of genotypes. (B) PCR products amplified from mouse tail DNA demonstrating the indicated genotypes. +, wildtype allele; KO, disrupted allele (from ubiquitously-acting Cre); flox, conditional allele. (C) Functional validation of Bmal1 condition allele: conditional loss of circadian rhythms of locomotor activity. Shown are representative double-plotted records of running-wheel activity in DD of mice homozygous for the conditional Bmal1 allele with or without a ubiquitously-acting Cre. Tick mark heights correspond to the number of running-wheel revolutions in a 6-min bin.
Figure 6
Figure 6. Retina-specific loss of Bmal1 function
(A) Retina-specific Cre activity from CHX10-Cre transgene. Sections of retina and SCN from indicator mice showing blue precipitate reporting Cre recombinase activity. For CHX10-Cre, blue stain at bottom of the brain is from retinal ganglion cell projections. PL, photoreceptor layer; INL, inner nuclear layer; GCL, ganglion cell layer. (B) Retina-specific disruption of Bmal1 conditional allele. Genomic southern showing fragments diagnostic of the conditional or disrupted Bmal1 alleles. 1−4, Retina DNA. 1, Homozygous Bmal1 conditional, ubiquitous Cre; 2, Heterozygous for disrupted allele; 3, Homozygous Bmal1 conditional, no Cre; 4, Homozygous Bmal1 conditional, CHX10-Cre; 5, Hypothalamus DNA from same mouse as (4). (C) Loss of BMAL1 protein from the retina. Anti-BMAL1 western blot of protein extracts from retinas of homozygous conditional Bmal1 mice with the indicated Cre. (D) Loss of Bmal1 function in retina but not SCN. In situ hybridization to retina and SCN sections showing expression of Bmal1-dependent genes Rev-erbα and Dbp in homozygous conditional Bmal1 mice carrying the indicated Cre transgene. Circadian times (CT) correspond to the peak (left) or trough (right) of transcript rhythms. (E) Loss of molecular rhythms in retina. Temporal expression profiles (Q-PCR) of the indicated genes in mice homozygous for the conditional Bmal1 allele with or without CHX10-Cre. Relative expression levels are plotted in arbitrary linear units.
Figure 7
Figure 7. Loss of circadian rhythm of inner retinal electrical activity in response to light in mice with a retina-specific deletion of Bmal1
(A) Examples of daytime ERG traces in response to a flash of light for conditional Bmal1 littermates with or without the CHX10-Cre. (B) Quantification of ERG responses (mean and SEM; N = 7 for each genotype). (C) Examples of ERG traces in response to a flash of light for conditional Bmal1 littermates with or without CHX10-Cre at two circadian times (CT) in constant light (LL). (D) Quantification of ERG b-wave amplitudes and implicit times (mean and SEM; N = 8 for controls and N = 7 for ret-Bmal1). P-values, t-tests. N.S., not significant.

References

    1. Abe M, Herzog ED, Yamazaki S, Straume M, Tei H, Sakaki Y, Menaker M, Block GD. Circadian rhythms in isolated brain regions. J. Neurosci. 2002;22:350–356. - PMC - PubMed
    1. Akhtar RA, Reddy AB, Maywood ES, Clayton JD, King VM, Smith AG, Gant TW, Hastings MH, Kyriacou CP. Circadian cycling of the mouse liver transcriptome, as revealed by cDNA microarray, is driven by the suprachiasmatic nucleus. Curr. Biol. 2002;12:540–550. - PubMed
    1. Bailey MJ, Beremand PD, Hammer R, Reidel E, Thomas TL, Cassone VM. Transcriptional profiling of circadian patterns of mRNA expression in the chick retina. J. Biol. Chem. 2004;279:52247–52254. - PubMed
    1. Barnard AR, Hattar S, Hankins MW, Lucas RJ. Melanopsin regulates visual processing in the mouse retina. Curr. Biol. 2006;16:389–395. - PubMed
    1. Balsalobre A, Damiola F, Schibler U. A serum shock induces circadian gene expression in cultured Rat-1 fibroblasts. Cell. 1998;93:929–937. - PubMed

Publication types

Substances

LinkOut - more resources