. 2008 Jan 1;314(1):52-67.
doi: 10.1016/j.yexcr.2007.07.024. Epub 2007 Jul 31.

The regulatory or phosphorylation domain of p120 catenin controls E-cadherin dynamics at the plasma membrane

Affiliations

The regulatory or phosphorylation domain of p120 catenin controls E-cadherin dynamics at the plasma membrane

Yuri Fukumoto et al. Exp Cell Res. .

Abstract

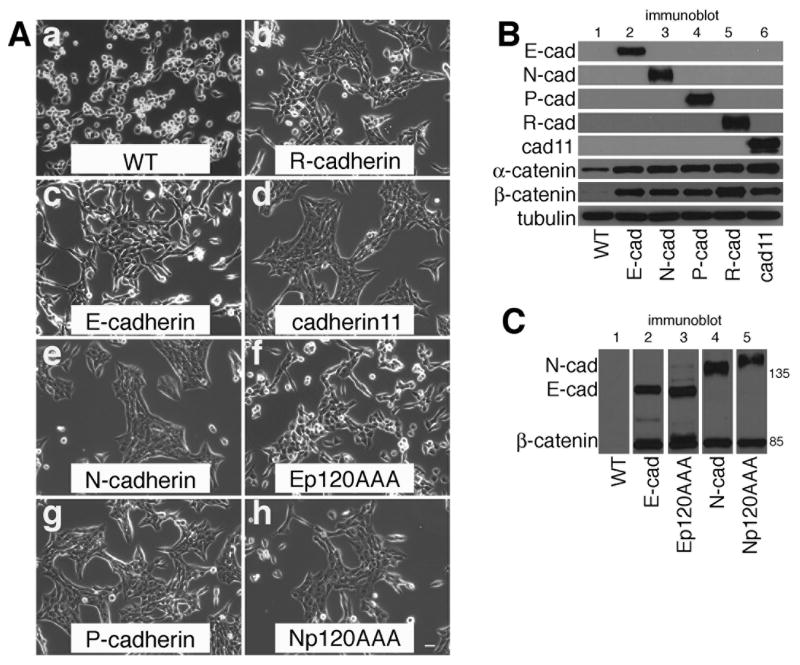
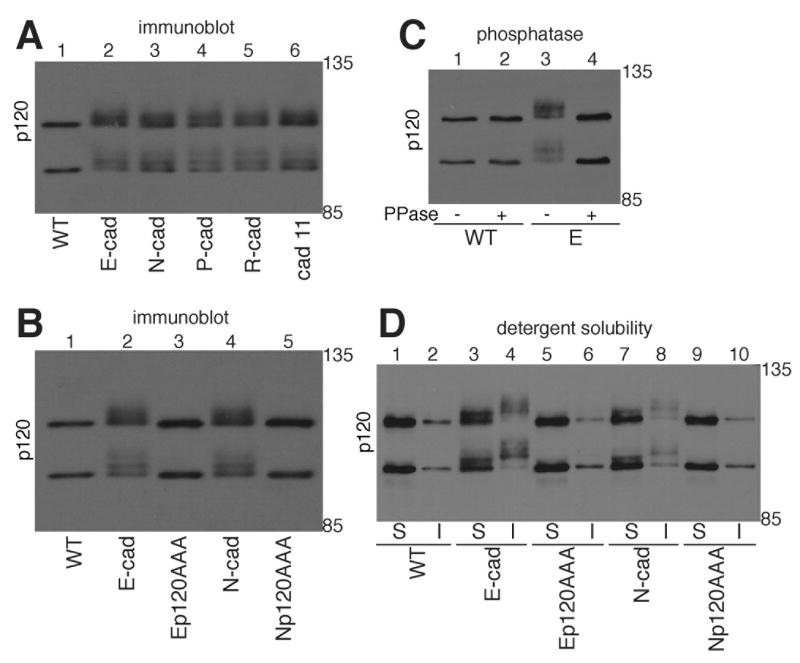
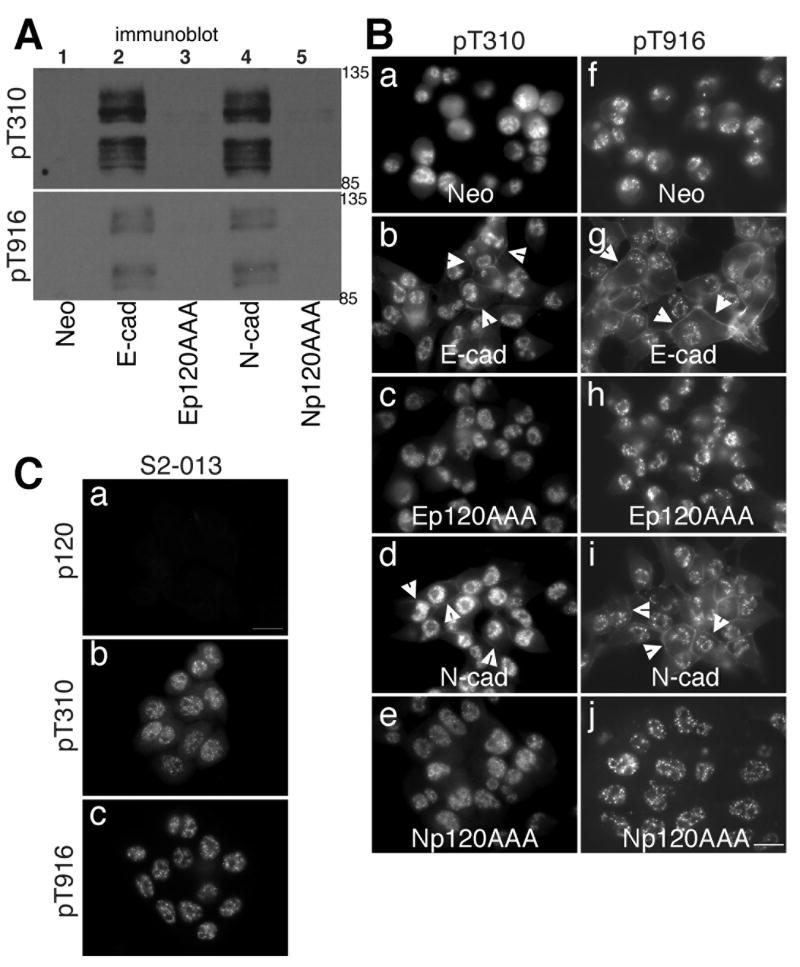
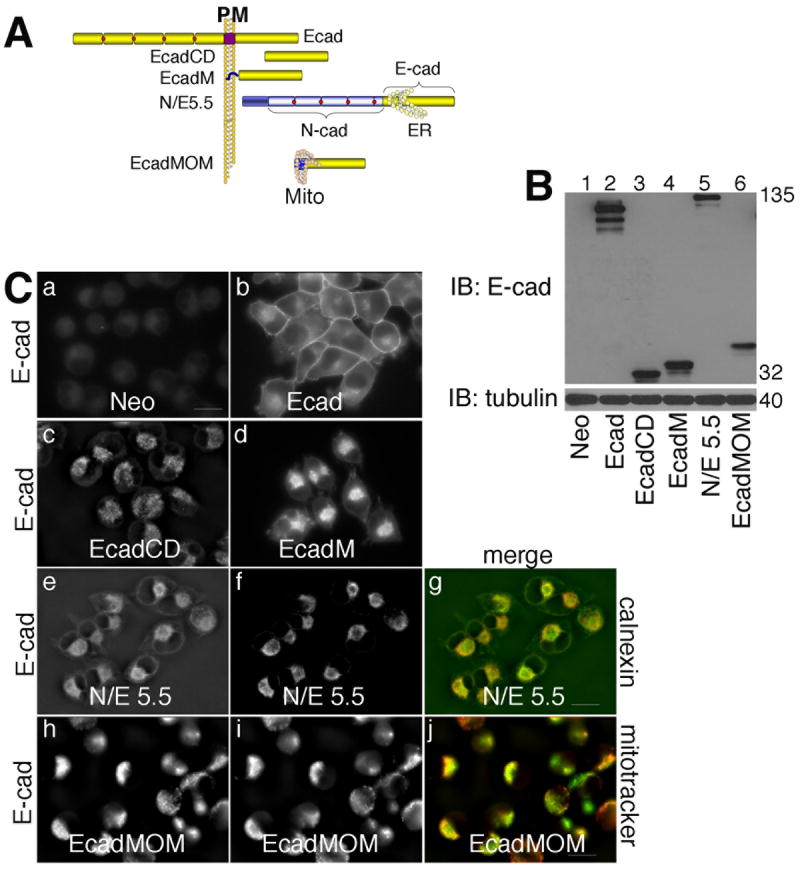
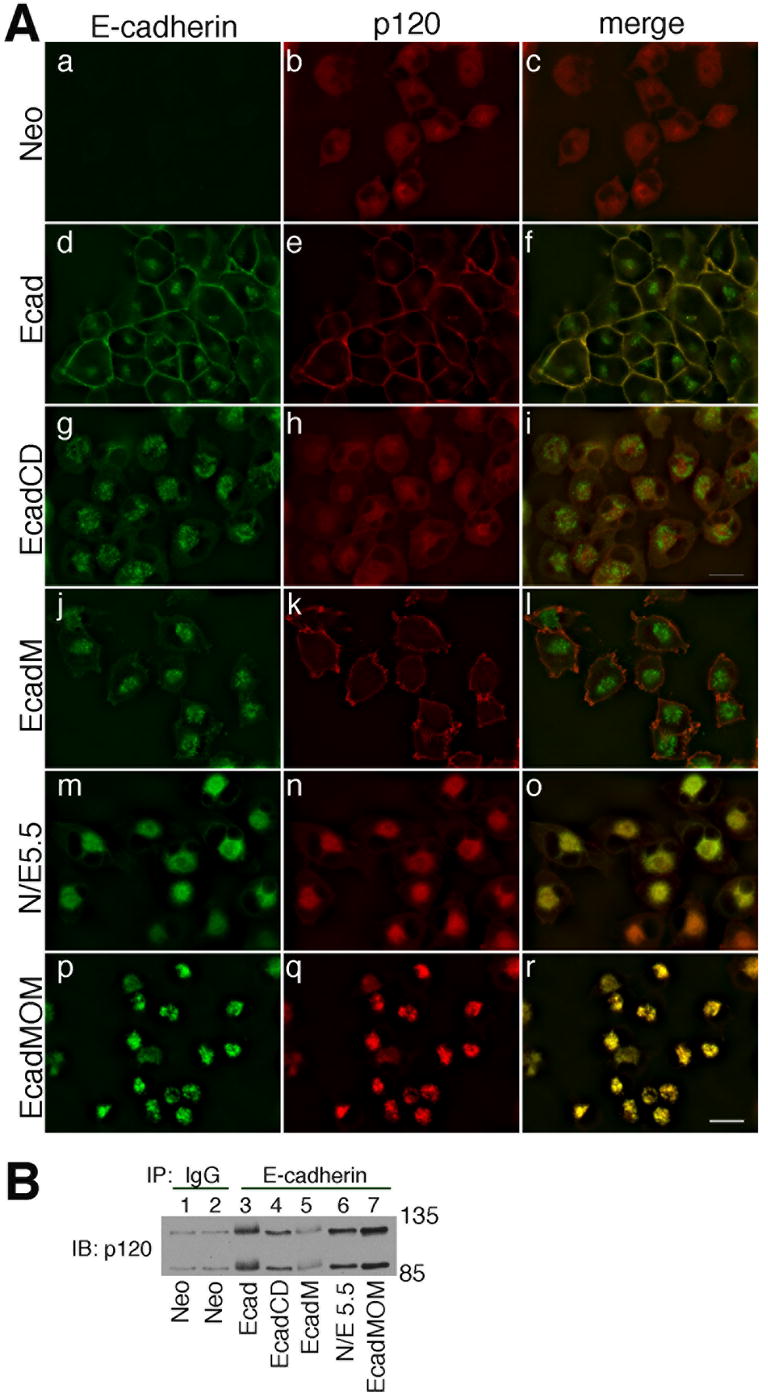
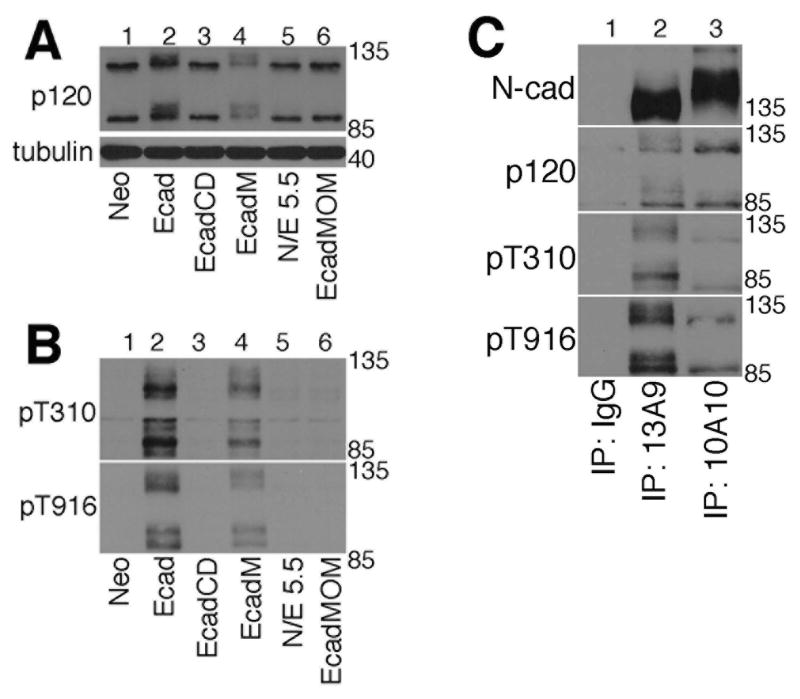
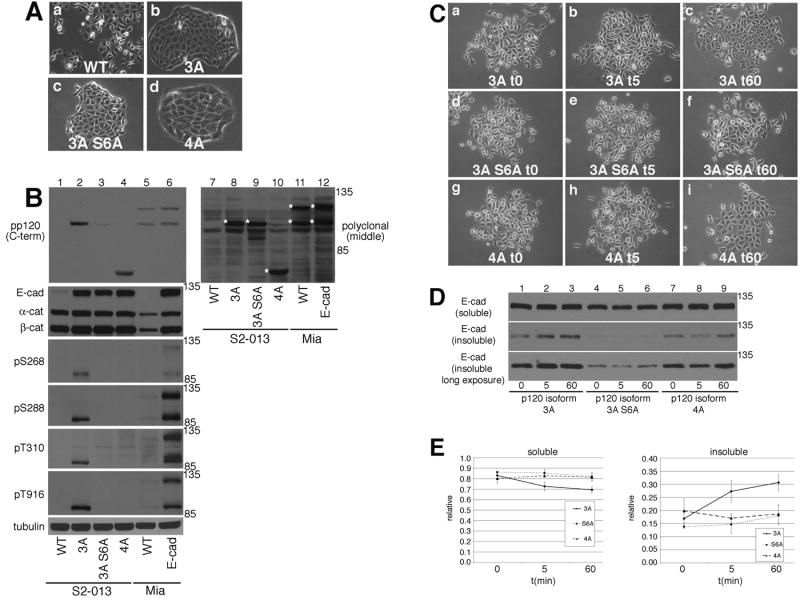
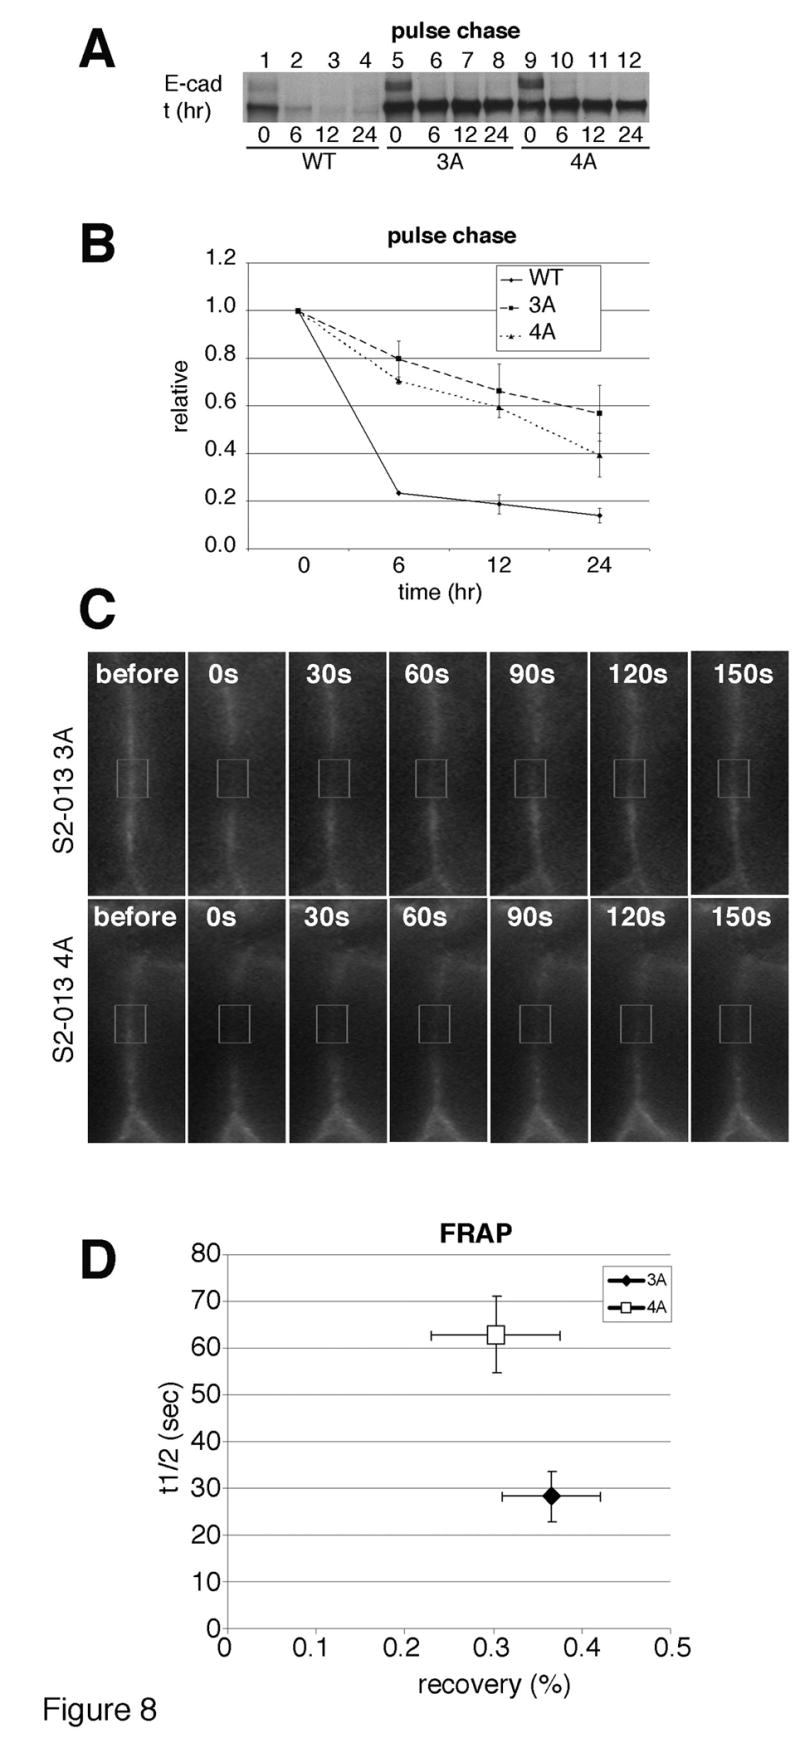
In contrast to growth factor-stimulated tyrosine phosphorylation of p120, its relatively constitutive serine/threonine phosphorylation is not well understood. Here we examined the role of serine/threonine phosphorylation of p120 in cadherin function. Expression of cadherins in cadherin-null cells converted them to an epithelial phenotype, induced p120 phosphorylation and localized it to sites of cell contact. Detergent solubility and immunofluorescence confirmed that phosphorylated p120 was at the plasma membrane. E-cadherin constructs incapable of traveling to the plasma membrane did not induce serine/threonine phosphorylation of p120, nor did cadherins constructs incapable of binding p120. However, an E-cadherin cytoplasmic domain construct artificially targeted to the plasma membrane did induce serine/threonine phosphorylation of p120, suggesting phosphorylation occurs independently of signals from cadherin dimerization and trafficking through the ER/Golgi. Solubility assays following calcium switch showed that p120 isoform 3A was more effective at stabilizing E-cadherin at the plasma membrane relative to isoform 4A. Since the major phosphorylation domain of p120 is included in isoform 3A but not 4A, we tested p120 mutated in the known phosphorylation sites in this domain and found that it was even less effective at stabilizing E-cadherin. These data suggest that serine/threonine phosphorylation of p120 influences the dynamics of E-cadherin in junctions.


Figures

Fig. 1
Fig. 1. Forced cadherin expression promotes cell-cell adhesion in MiaPaCa-2 cells
A: Phase micrographs of parental MiaPaCa-2 cells (a, WT), MiaPaCa-2 cells expressing E-cadherin (c), N-cadherin (e), P-cadherin (g), R-cadherin (b), cadherin-11 (d), E-cadherin with a p120 uncoupling mutation (f, Ep120AAA), or N-cadherin with a p120 uncoupling mutation (h, Np120AAA). Photographs were taken using a 10 X objective. Bar = 20 μm B: TNE extracts of parental MiaPaCa-2 cells (lane 1, WT) MiaPaCa-2 cells expressing E-cadherin (lane 2), N-cadherin (lane 3), P-cadherin (lane 4), R-cadherin (lane 5) or cadherin-11 (lane 6) were immunoblotted for each cadherin, α-catenin, β-catenin and tubulin. C: TNE extracts of parental MiaPaCa-2 cells (lane 1, WT), MiaPaCa-2 cells expressing E-cadherin (lane 2), E-cadherin with a p120 uncoupling mutation (lane 3), N-cadherin (lane 4), or N-cadherin with a p120 uncoupling mutation (lane 5) were immunoblotted for N-cadherin, E-cadherin and β-catenin.
Fig. 2
Fig. 2. Forced cadherin expression induces phosphorylation of p120
A: TNE extracts of parental MiaPaCa-2 cells (lane 1, WT), MiaPaCa-2 cells expressing E-cadherin (lane 2), N-cadherin (lane 3), P-cadherin (lane 4), R-cadherin (lane 5) or cadherin-11 (lane 6) were immunoblotted for p120. B: TNE extracts of parental MiaPaCa-2 cells (lane 1, WT), MiaPaCa-2 cells expressing E-cadherin (lane 2), E-cadherin with a p120 uncoupling mutation (lane 3), N-cadherin (lane 4) or N-cadherin with a p120 uncoupling mutation (lane 5) were immunoblotted for p120. C: Extracts of MiaPaCa-2 cells and MiaPaCa cells expressing E-cadherin were immunoprecipitated with anti-p120 and treated with or without λ phosphatase. The immunoprecipitates were resolved by SDS-PAGE and immunoblotted for p120. Lane 1) untreated parental MiaPaCa-2 cells. Lane 2) phosphatase-treated parental MiaPaCa-2 cells. Lane 3) untreated MiaPaCa-2 cells expressing E-cadherin. Lane 4) phosphatase treated MiaPaCa-2 cells expressing E-cadherin. D: Soluble (S) and insoluble (I) fractions of extracts from parental MiaPaCa-2 cells (lanes 1 and 2), MiaPaCa-2 cells expressing E-cadherin (lanes 3 and 4), E-cadherin with a p120 uncoupling mutation (lanes 5 and 6), N-cadherin (lanes 7 and 8) or N-cadherin with a p120 uncoupling mutation (lane 9 and 10) were immunoblotted for p120.
Fig. 3
Fig. 3. Phosphorylation of p120 on T310 and T916 in cadherin-expressing MiaPaCa-2 cells
A: TNE extracts of mock transduced MiaPaCa-2 cells (lane 1, Neo), MiaPaCa-2 cells expressing E-cadherin (lane 2), E-cadherin with a p120 uncoupling mutation (lane 3), N-cadherin (lane 4) or N-cadherin with a p120 uncoupling mutation (lane 5) were immunoblotted for phosphorylated T310 residue (top) or phosphorylated T916 residue (bottom) of p120. B: Mock transduced MiaPaCa-2 cells (a and f), MiaPaCa-2 cells expressing E-cadherin (b and g), E-cadherin with a p120 uncoupling mutation (c and h), N-cadherin (d and i) or N-cadherin with a p120 uncoupling mutation (e and j) were fixed with 10% trichloroacetic acid and stained with antibodies specific for p120 phosphorylated at T310 residue (panels a-e) or T916 residue (panels f-j). Photographs were taken using a 60 X oil objective. Bar = 20 μm. C: p120-deficient S2-013 cells were fixed with 10% trichloroacetic acid and stained with an antibody that recognizes all p120 isoforms (panel a), or antibodies that recognize only p120 that is phosphorylated at T310 (panels b) or T916 (panel c). Photographs were taken using a 60 X oil objective. Bar = 20 μm.
Fig. 4
Fig. 4. Modified E-cadherin mutants targeted to different cellular membranes
A: Schematic diagram of modified E-cadherin constructs: full length E-cadherin (E); the cytoplasmic tail of E-cadherin (amino acids 732-882, E-cadCD); the cytoplasmic tail of E-cadherin with the plasma membrane targeting sequence from v-Src added to the amino-terminus (E-cadM); a chimeric construct between N-cadherin and E-cadherin that remains trapped in the ER membrane (N/E5.5); and the cytoplasmic tail of E-cadherin with a mitochondrial outer membrane targeting sequence added to the amino-terminus (E-cadMOM). B: TNE extracts of mock infected MiaPaCa-2 cells (lane 1), or cells expressing the constructs described in panel A were resolved by SDS-PAGE and immunoblotted for E-cadherin (top) and tubulin (bottom). C: Mock infected MiaPaCa-2 cells (a), or cells expressing E-cadherin (b), EcadCD (c), EcadM (d), N/E 5.5 cadherin (e), or EcadMOM (h) were stained for E-cadherin. Cells expressing the N/E 5.5 construct were stained with the ER marker, calnexin (f). Cells expressing EcadMOM were stained with mitochondrial marker, Mitotracker (i). Merged pictures were taken of cells expressing N/E 5.5 (g) and EcadMOM (j) to illustrate co-localization with calnexin and Mitotracker, respectively. Photographs were taken using a 60 X oil objective. Scale bar = 20 μm.
Fig. 5
Fig. 5. Modified E-cadherin constructs colocalize and physically interact with p120 in MiaPaCa-2 cells
A: MiaPaCa-2 cells expressing the neomycin resistance gene (a-c), E-cadherin (d-f), EcadCD (g-i), EcadM (j-l), N/E 5.5 (m-o) or EcadMOM (p-r) were stained for E-cadherin and p120. Photographs were taken using a 60 X oil objective. Bar = 20 μm. B: TNE extracts of cells shown in panel A were immunoprecipitated with anti-E-cadherin, resolved by SDS-PAGE and immunoblotted for p120 (lanes 2-7). The mock cells were immunoprecipitated with normal mouse IgG and immunoblotted for p120 as an antibody control (lane1).
Fig. 6
Fig. 6. Phosphorylation of p120 requires plasma-membrane association but not signals from cadherin-cadherin engagement
A: TNE extracts of MiaPaCa-2 cells expressing the neomycin resistance gene (lane 1), E-cadherin (lane 2), EcadCD (lane 3), EcadM (lane 4), N/E 5.5 (lane 5), or EcadMOM (lane 6) were resolved by SDS-PAGE and immunoblotted for p120 (top) and tubulin (bottom). B: TNE extracts of MiaPaCa-2 cells expressing the neomycin resistance gene (lane 1), E-cadherin (lane 2), EcadCD (lane 3), EcadM (lane 4), N/E 5.5 (lane 5), or EcadMOM (lane 6) were resolved by SDS-PAGE and immunoblotted for p120 phosphorylated at T310 (top) and p120 phosphorylated at T916 residue (bottom). C: TNE extracts of MiaPaCa-2 cells expressing N-cadherin were immunoprecipitated with an antibody that recognizes the pro-region of immature N-cadherin (10A10, lane 3) to pull down only the immature N-cadherin, or with an antibody that recognizes the cytoplasmic domain of N-cadherin (13A9, lane 2) to pull down all forms of N-cadherin. Immunoprecipitates were resolved by SDS-PAGE and immunoblotted for N-cadherin (using 13A9), p120, and p120 phosphorylated at T310 and T916. Normal mouse IgG was used as a negative control for immunoprecipitations (lane 1).
Fig. 7
Fig. 7. Analysis of p120 isoforms 3A and 4A in p120-deficient S2-013 cells
A: Phase contrast micrographs of parental S2-013 cells (a), S2-013 cells expressing p120 isoform 3A (b), S2-013 cells expressing p120 isoform 3A with six residues of S/T mutated to alanine 3AS6A(c), and S2-013 cells expressing p120 isoform 4A(d) were taken using a 10 X phase objective. Bar = 20 μm B: TNE extracts of parental S2-013 cells (lane 1, WT), S2-013 cells expressing mouse p120 isoform 3A (lane 2), S2-013 cells expressing 3A S6A (lane 3), S2-013 cells expressing isoform 4A (lane 4), parental MiaPaCa-2 cells (lane 5), and MiaPaCa-2 cells expressing E-cadherin (lane 6) were resolved by SDS-PAGE and immunoblotted for p120 (top left, using pp120 antibody, which recognizes the C-terminus of p120; and top right, polyclonal antibody from Bethyl Labs, which recognizes a region between AA 625 and 681 of p120), E-cadherin, alpha-catenin, beta-catenin, p120 phosphorylated on S268, S288, T310, T916 residues, and tubulin. We used the polyclonal antibody to confirm the expression of p120 3A S6A because this mutated p120 is not efficiently recognized by the pp120 antibody. The polyclonal antibody has a high background on immunoblots, so we have pointed out the relevant bands by asterisks. C: S2013 expressing p120 isoform 3A, the S6A mutant of 3A or isoform 4A were untreated (t0, a, d, and g), treated for 5 minutes (t5, b, e, and h), or treated for 1 hour (t60, c, f, and i) with 1.8 mM calcium. Photographs were taken using a 20 X phase objective. D: Soluble (top panel) and insoluble (bottom two panels) fractions were prepared from S2-013 cells expressing p120 isoform 3A, the S6A mutant form of 3A or isoform 4A at time 0 (lanes 1, 4, 7), 5 minutes (lanes 2, 5, 8) or 60 minutes (lanes 3, 6, 9) after switching to 1.8 mM calcium. Each fraction was resolved by SDS-PAGE and immunoblotted for E-cadherin. The bottom panel is a long exposure of the middle panel to show that cells expressing the S6A mutant form of p120 do recover E-cadherin in this time frame. E: Data from Fig. 7D (3 independent experiments) were quantified via densitometry using Adobe Photoshop histogram. Standard deviations are indicated.
Fig. 8
Fig. 8. Junctional E-cadherin recovers more rapidly in cells expressing p120 isoform 3A than in cells expressing p120 isoform 4A
A: Parental S2-013 cells and S2-013 cells expressing p120 isoform 3A or isoform 4A were serum starved overnight in cysteine/methionine free medium and labeled with [35S]cysteine/methionine for 1 hour. Cells were extracted immediately (0 time; lanes 1, 5, and 9), or chased for 6 hours (lanes 2, 6, and 10), 12 hours (lanes 3, 7, and 11) or 24 hours (lanes 4, 8, and 12) in complete medium. TNE extracts at each time course were immunoprecipitated with anti-E-cadherin, resolved by SDS-PAGE and labeled protein was visualized by autoradiography. B: E-cadherin expression levels from Fig. 8A were quantified by densitometry using Adobe Photoshop histogram from 2 independent experiments. C: The recovery rate of junctional E-cadherin-GFP was monitored after photo-bleaching a small region (indicated in the box) at sites of cell-cell contact in S2-013 expressing p120 isoform 3A (upper panels) or isoform 4A (lower panels) cells. Cells were photographed before photobleaching and every 30 seconds after photobleaching. D: Fluorescence recovery after photobleaching (FRAP) was quantified from ten independent measurements for the cells shown in Figure 8C. The X-axis indicates the mobile fraction of E-cadherin (recovery, %), and the y-axis indicates the half-life (t1/2) in seconds. The standard deviation is indicated.

Similar articles

Cited by

References

    1. Takeichi M. Morphogenetic roles of classic cadherins. Curr Opin Cell Biol. 1995;7:619–627. - PubMed
    1. Chen WC, Obrink B. Cell-cell contacts mediated by E-cadherin (uvomorulin) restrict invasive behavior of L-cells. J Cell Biol. 1991;114:319–327. - PMC - PubMed
    1. Frixen UH, Behrens J, Sachs M, Eberle G, Voss B, Warda A, Lochner D, Birchmeier W. E-cadherin-mediated cell-cell adhesion prevents invasiveness of human carcinoma cells. J Cell Biol. 1991;113:173–185. - PMC - PubMed
    1. Wheelock MJ, Johnson KR. Cadherins as modulators of cellular phenotype. Annu Rev Cell Dev Biol. 2003;19:207–235. - PubMed
    1. Thoreson MA, Reynolds AB. Altered expression of the catenin p120 in human cancer: implications for tumor progression. Differentiation. 2002;70:583–589. - PubMed

Publication types

MeSH terms