Comparative Study
. 2008 May;18(5):1058-78.
doi: 10.1093/cercor/bhm137. Epub 2007 Aug 23.

Lack of orientation and direction selectivity in a subgroup of fast-spiking inhibitory interneurons: cellular and synaptic mechanisms and comparison with other electrophysiological cell types

Affiliations
Comparative Study

Lack of orientation and direction selectivity in a subgroup of fast-spiking inhibitory interneurons: cellular and synaptic mechanisms and comparison with other electrophysiological cell types

Lionel G Nowak et al. Cereb Cortex. 2008 May.

Erratum in

  • Cereb Cortex. 2008 Nov;18(11):2717

Abstract

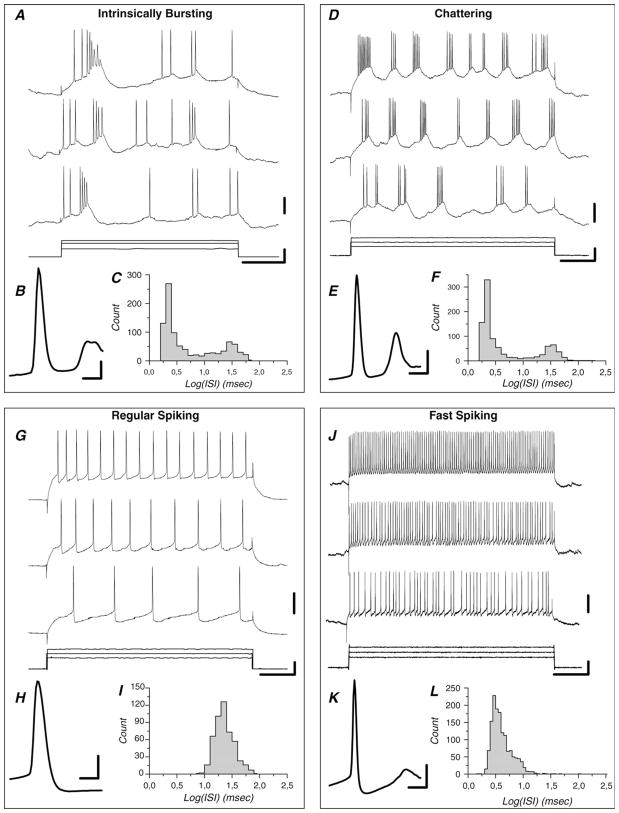
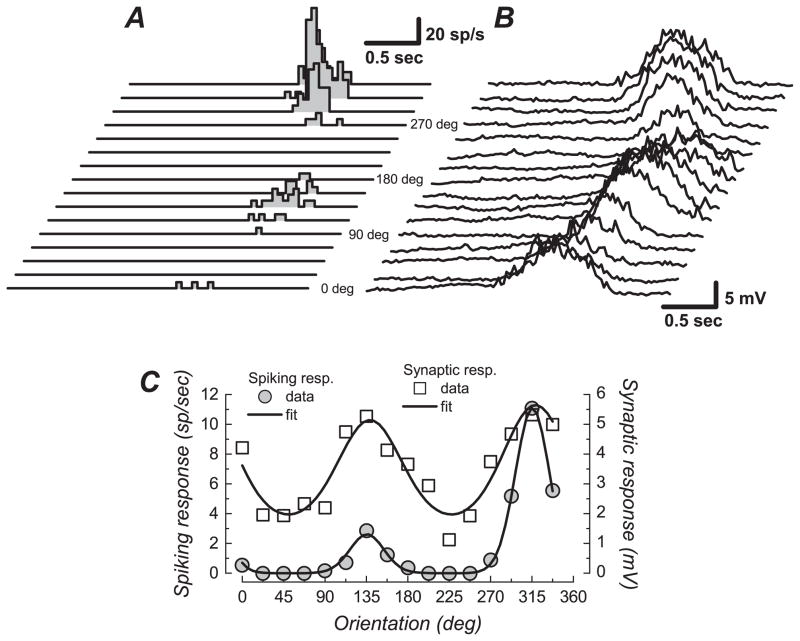
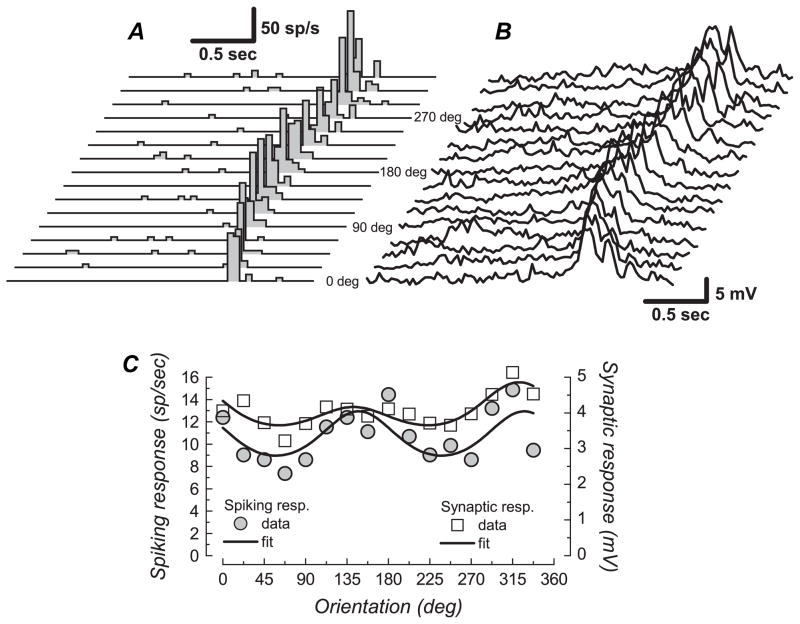
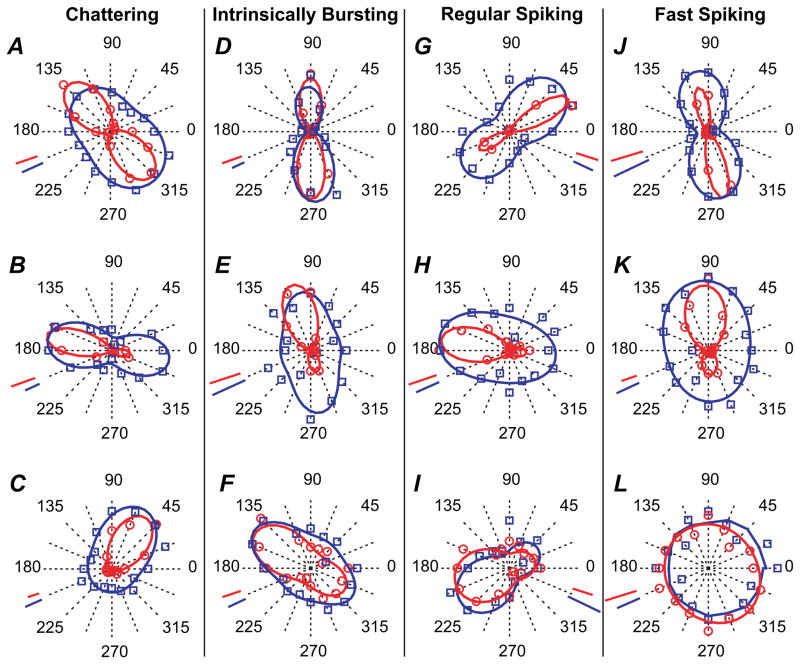
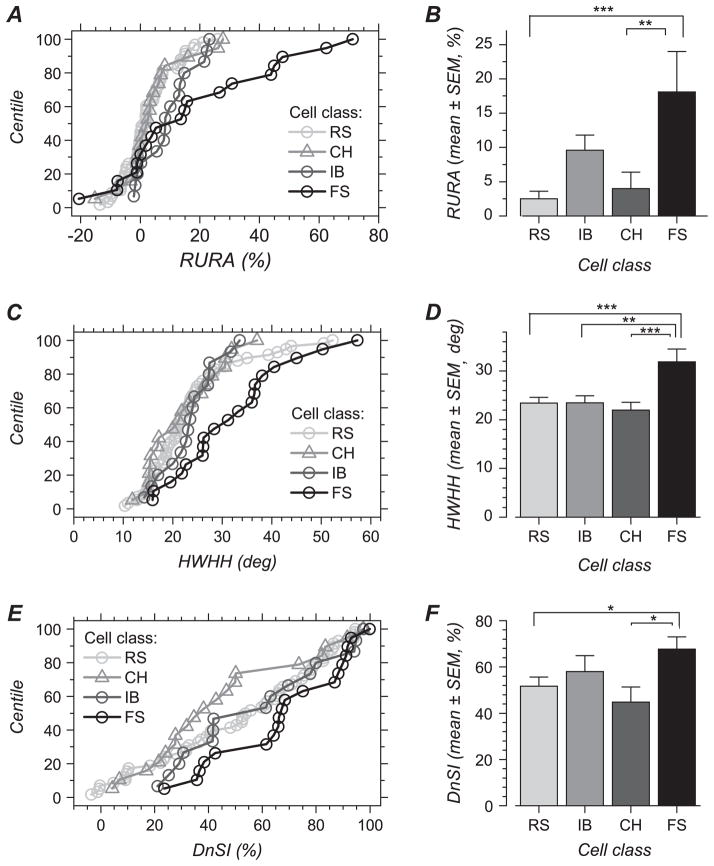
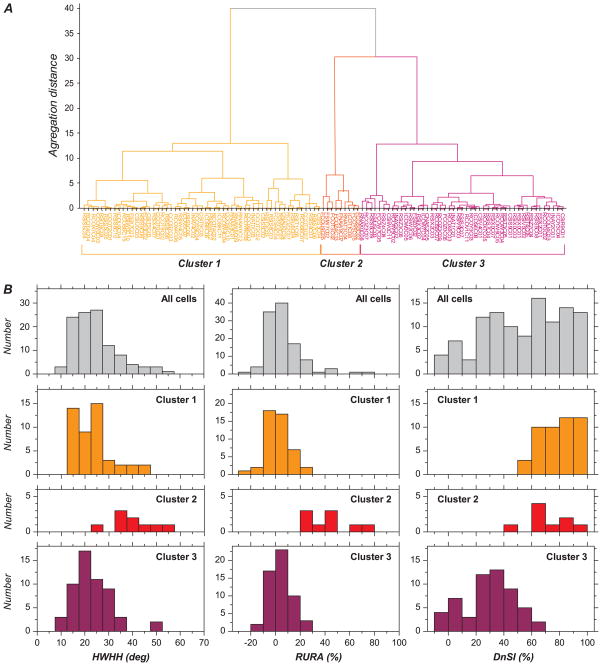
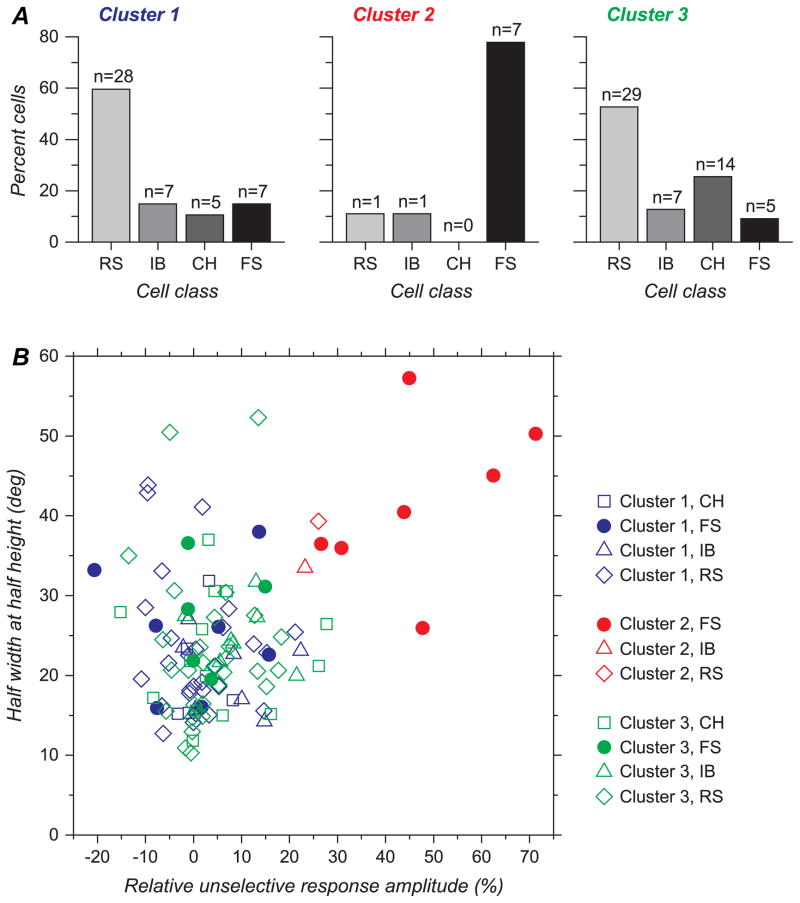
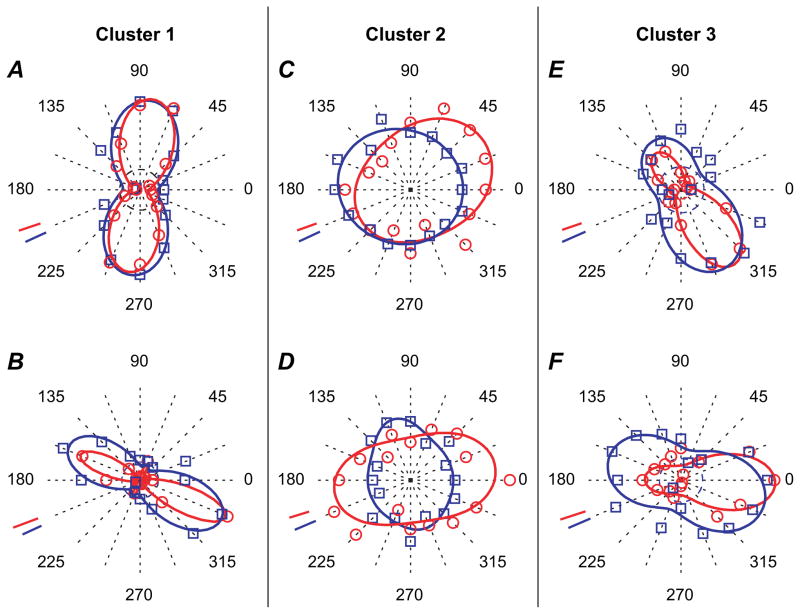
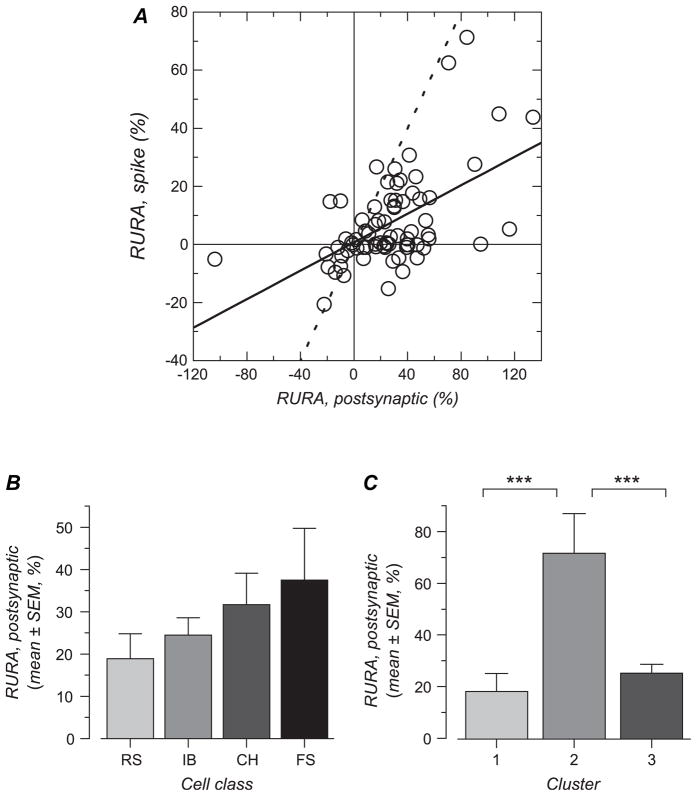
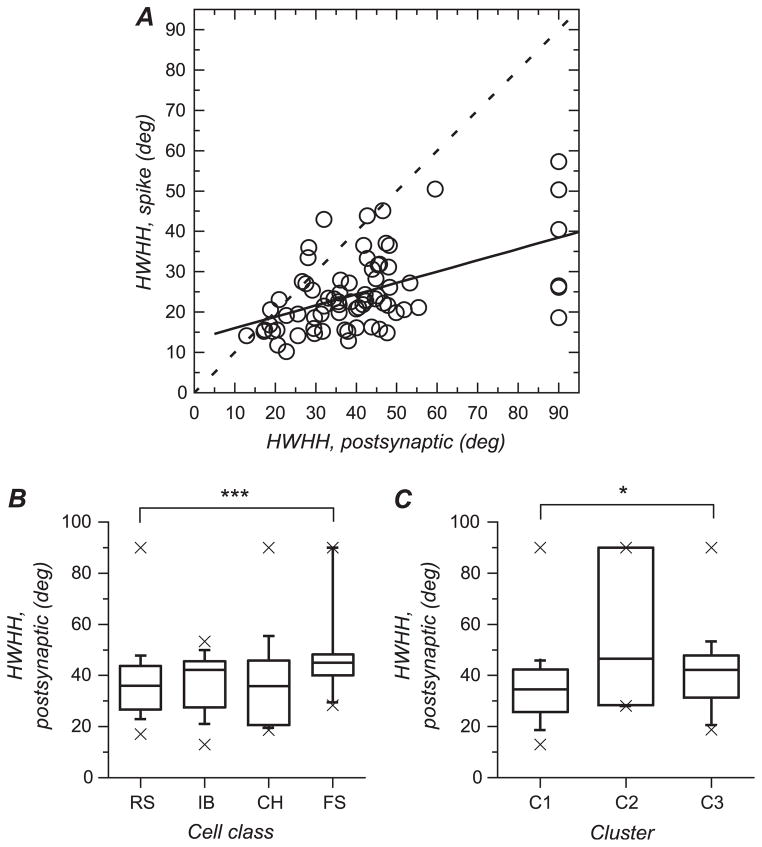
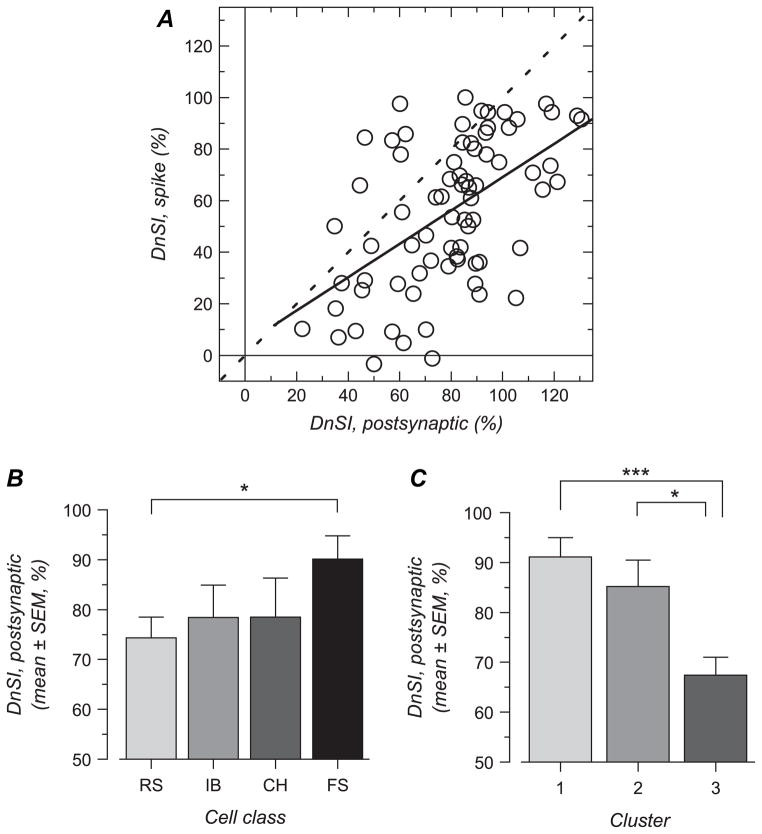
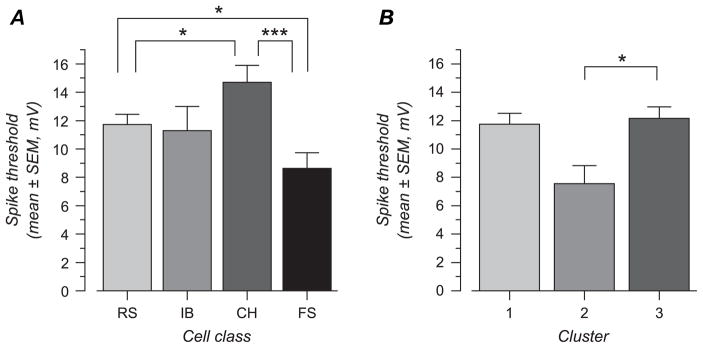
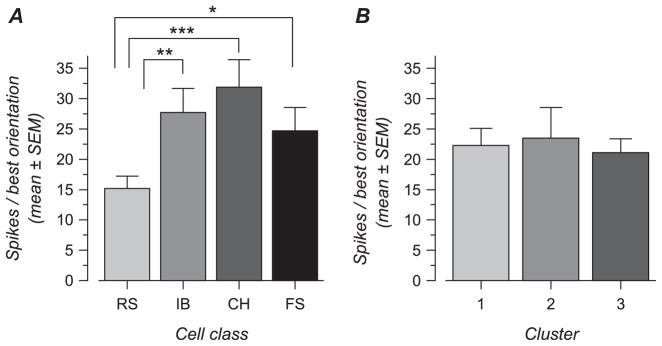
Neurons in cat area 17 can be grouped in 4 different electrophysiological cell classes (regular spiking, intrinsically bursting, chattering, and fast spiking [FS]). However, little is known of the functional properties of these different cell classes. Here we compared orientation and direction selectivity between these cell classes in cat area 17 and found that a subset of FS inhibitory neurons, usually with complex receptive fields, exhibited little selectivity in comparison with other cell types. Differences in occurrence and amplitude of gamma-range membrane fluctuations, as well as in numbers of action potentials in response to optimal visual stimuli, did not parallel differences observed for orientation and direction selectivity. Instead, differences in selectivity resulted mostly from differences in tuning of the membrane potential responses, although variations in spike threshold also contributed: weakly selective FS neurons exhibited both a lower spike threshold and more broadly tuned membrane potential responses in comparison with the other cell classes. Our results are consistent with the hypothesis that a subgroup of FS neurons receives connections and possesses intrinsic properties allowing the generation of weakly selective responses. The existence of weakly selective inhibitory neurons is consistent with orientation selectivity models that rely on broadly tuned inhibition.


Conflict of interest statement

Conflict of Interest: None declared.

Figures

Figure 1
Figure 1
Representative examples of the 4 different cell classes that can be identified in cat area 17 by their electrophysiological features. (A–C) IB cell. (D–F) CH cell. (G–I) RS cell. (J–K) FS cell. Log(ISIs) are unimodal in nonburst-generating neurons (I, L) and bimodal in burst-generating neurons (C, F). Action potentials are thinner in the CH cell (E) and in the FS cell (K) in comparison with the IB cell (B) and the RS cell (H). Bursts discharge tends to inactivate in the IB cell (A) but persists for the whole current pulse duration in the CH cell (D). The RS cell shows firing rate adaptation (G) but the FS cells do not (J). Horizontal scale bars (A, D, G, and J) represent 50 ms. Vertical scale bars in (A, D, G, and J) correspond to 0.5 nA (bars next to current pulses) and 20 mV (bars next to lowest voltage traces. In (B, E, H, and K), horizontal bars represent 1 ms and vertical bars 20 mV.
Figure 2
Figure 2
Orientation tuning in a sharply tuned FS cell. (A) Spike response PSTHs for the 16 drifting bar stimuli (8 unique orientations and 2 motion directions). (B) Membrane potential average for the same stimuli. Resting membrane potential was −71 mV. (C) Fit of Von Mises equations to the spiking response (mean firing rate, scale on left) and to the synaptic response (mean membrane potential change, scale on right). The spiking response was sharply tuned for orientation (HWHH: 22 deg) and strongly direction selective (DnSI: 23%). The synaptic response was less orientation and direction selective (HWHH: 42 deg, DnSI: 91%). Note the presence of a significant depolarization for all the stimulus orientations (RURA: 26%).
Figure 3
Figure 3
Broadly tuned FS cell. (A) Spike response PSTH for the 16 directions. (B) Membrane potential average for the 16 directions. Resting membrane potential was −74 mV. (C) Von Mises fits to the spiking and synaptic responses. For the spiking response, the high RURA value (62%) and the large HWHH for the tuned response component (45 deg) indicate this cell was weakly orientation selective. The synaptic response was even less selective (RURA: 71%, HWHH: 47 deg).
Figure 4
Figure 4
Polar plots illustrating examples of orientation tuning curves for neurons belonging to the 4 electrophysiologically defined cell classes. The experimental data are displayed as data points, and the continuous lines represent the best fit to these data obtained with modified Von Mises’ formula. Data and lines in red correspond to spiking responses and data and lines in blue to postsynaptic responses. (A–C) Orientation tuning in CH cells. (D–F) Orientation tuning in IB cells. (G–I) Orientation tuning in RS cells. (J–L) Additional examples of orientation tuning in FS cells. For the FS cell in (L), the postsynaptic data could not be fit and the line corresponds, for illustration purpose only, to a smoothed (3 point average) version of the actual data. Scale bars in red represent 10 spikes/s except in (G) (3 spikes/s), (I) (5 spikes/s), (J) (5 spikes/s), and (K) (20 spikes/s). Scale bars in blue represent 2 mV except in (K) (1 mV) and (L) (1 mV).
Figure 5
Figure 5
Orientation and direction selectivity for spiking responses in electrophysiologically defined cell classes. (A) Cumulative distribution of RURA for each cell class. (B) Mean RURA for each cell class. (C) Cumulative distribution of orientation tuning HWHH for each cell class. (D) Mean HWHH for each cell class. (A) Cumulative distribution of DnSI for each cell class. (B) Mean DnSI for each cell class. Bars in (B, D, and F) represent one standard error of the mean. Significant differences between cell classes are indicated by stars, and the number of stars represents 3 significance level: ***, P < 0.001; **, 0.001 < P < 0.01; *, 0.01 < P < 0.05.
Figure 6
Figure 6
Cluster analysis based segregation of 3 functional cell classes. (A) Hierarchical tree summarizing segregation of cells on the basis of the 3 variables used for quantification of orientation and direction selectivity. Main bifurcation at relatively large aggregation distances (distances ~40 and 30) leads to 3 well-isolated groups, labeled as cluster 1, cluster 2, and cluster 3. (B) Distribution histograms of HWHH (left), RURA (middle), and DnSI (right) for all the cells together and for each of the 3 clusters. Distributions for clusters 1, 2, and 3 are presented on the second, third, and fourth rows, respectively. For purpose of comparison, distribution for all the cells together is shown on the first row. Cluster 2 is different from clusters 1 and 3 in that it contains cells with larger HWHH and larger RURA. Cluster 2 appears to concentrate most of the cells that produced the skew in the total population histograms for RURA and HWHH. Cluster 3 is distinct from clusters 1 and 2 in that it contains cells that are more direction selective. This corresponds to the first mode in the distribution of DnSI when considering all of the cells together.
Figure 7
Figure 7
(A) Proportion of each cell type in the 3 groups revealed by cluster analysis. Proportion of FS cells is much higher, and reciprocally, proportion of CH, RS, and IB cells much lower, in cluster 2 compared with clusters 1 and 3. (B) Scatter diagram representing HWHH versus RURA. Cluster 2 concentrates most of the cells with high values of HWHH together with high values of RURA. The 2 non-FS cells appear near the margin of clouds of dots representing cluster 2.
Figure 8
Figure 8
Polar plots illustrating additional examples of orientation tuning curves for FS cells belonging to the 3 functionally defined clusters. The experimental data are displayed as data points, and the continuous lines represent the best fit to these data obtained with modified Von Mises’ formula. Data and lines in red correspond to spiking responses and data and lines in blue to postsynaptic responses. (A, B) FS cells of cluster 1. Cluster 1 corresponds to cells that are orientation selective but not direction selective. (C, D) FS cells of cluster 2. Cells belonging to cluster 2 appear broadly tuned for orientation and direction. (E, F) FS cells of cluster 3. Cluster 3 contains cells that show both orientation and direction selectivity. Scale bars in red represent 20 spikes/s in (A), 5 spikes/s in (B), 5 spikes/s in (C), 1 spikes/s in (D), 2 spikes/s in (E), and 5 spikes/s in (F). Scale bars in blue represent 2 mV except in (A, E, and F) and 1 mV in (B, C, and D).
Figure 9
Figure 9
Relative amplitude of the unselective response in the postsynaptic response and its relationship with relative amplitude of the unselective response in the spiking response. (A) RURA for spiking responses is plotted against RURA for postsynaptic responses for the whole population. The 2 variables are significantly correlated. The result of the linear regression analysis is shown by the solid line. For comparison, the dashed line shows a line of slope one. (B) Mean and standard error of mean (SEM) values for RURA calculated for the membrane potential response for each of the 4 electrophysiologically defined cell classes. Cell classes did not differ significantly. (C) Mean and SEM of RURA for each of the 3 clusters defined by orientation and direction selectivity. RURA was significantly larger for cells in cluster 2 compared with cells in clusters 1 and 3 (***, P < 0.001).
Figure 10
Figure 10
HWHH of orientation tuning curves calculated for postsynaptic responses and relationship with spiking responses. (A) HWHH for spiking response plotted against HWHH for postsynaptic response. The 2 variables are significantly correlated. The regression line is represented by the solid line. The dashed line shows a line of slope one. Comparing the 2 lines also shows that HWHH for spike responses are quite systematically lower than HWHH for membrane potential responses. (B) Box plot representation summarizing HWHH for responses at the membrane potential level for each of the 4 electrophysiologically defined cell classes. The box delimits the 50% of the sample centered on the median, which is represented by the horizontal line within the box. Vertical lines and caps delimit the 10–90% centiles range. Crosses represent largest and smallest values. HWHH was significantly larger in FS cells compared with RS cells (***, P < 0.001). (C) Box plot for HWHH for each of the 3 clusters defined by orientation and direction selectivity. HWHH is significantly larger in cluster 3 compared with cluster 1 (*, 0.01 < P < 0.05).
Figure 11
Figure 11
Direction selectivity for postsynaptic responses and relationship with spiking responses. (A) When considering the whole population, DnSI for spiking response is significantly correlated with DnSI for synaptic responses. The result of the linear regression analysis is shown by the solid line. For comparison, the dashed line shows a line of slope one. (B) Mean and standard error of mean (SEM) values for DnSI calculated for the membrane potential response for each of the 4 electrophysiologically defined cell classes. RS and FS cells showed a significant difference (*, 0.01 < P < 0.05). (C) Mean and SEM of DnSI shown for each of the 3 functionally defined clusters. Synaptic responses for cells in cluster 3 are more orientation selective (lower DnSI) than cells in clusters 2 and 1 (*, 0.01 < P < 0.05; ***, P < 0.001).
Figure 12
Figure 12
Spike threshold varies between cell types and functionally defined clusters. (A) Spike threshold in electrophysiologically defined cell type. The lowest average spike threshold was found in FS and the highest in CH cells, with RS and IB cells occupying intermediate range. Differences were significant between FS and CH cells, between FS and RS cells, and between RS and CH cells. (B) Spike threshold for cells in cluster 2 is significantly lower than spike threshold in cluster 3. Stars indicate significance level: *, 0.01 < P < 0.05; ***, P < 0.001.
Figure 13
Figure 13
Number of spikes induced by the preferred stimulus orientation. (A) RS cells show maximal firing rate that are lower than those obtained in other cell classes. (B) The number of spikes elicited by the optimal stimulus does not differ between functionally defined clusters.

Similar articles

Cited by

References

    1. Adelson EH, Bergen JR. Spatiotemporal energy models for the perception of motion. J Opt Soc Am A. 1985;2:284–299. - PubMed
    1. Ahmed B, Anderson JC, Martin KAC, Nelson JC. Map of the synapses onto layer 4 basket cells of the primary visual cortex of the cat. J Comp Neurol. 1997;380:230–242. - PubMed
    1. Albrecht DG, Geisler WS. Motion selectivity and the contrast-response function of simple cells in the visual cortex. Vis Neurosci. 1991;7:531–546. - PubMed
    1. Albus K. A quantitative study of the projection area of the central and the paracentral visual field in area 17 of the cat. II. The spatial organization of the orientation domain. Exp Brain Res. 1975;24:181–202. - PubMed
    1. Anderson JS, Lampl I, Gillespie DC, Ferster D. The contribution of noise to contrast invariance of orientation tuning in cat visual cortex. Science. 2000;290:1968–1972. - PubMed

Publication types