Comparative Study
. 2007;35(17):e112.
doi: 10.1093/nar/gkm639. Epub 2007 Aug 24.

Comparative assessment of plasmid and oligonucleotide DNA substrates in measurement of in vitro base excision repair activity

Affiliations
Comparative Study

Comparative assessment of plasmid and oligonucleotide DNA substrates in measurement of in vitro base excision repair activity

Esther W Hou et al. Nucleic Acids Res. 2007.

Abstract

Mammalian base excision repair (BER) is mediated through at least two subpathways designated 'single-nucleotide' (SN) and 'long-patch' (LP) BER (2-nucleotides long/more repair patch). Two forms of DNA substrate are generally used for in vitro BER assays: oligonucleotide- and plasmid-based. For plasmid-based BER assays, the availability of large quantities of substrate DNA with a specific lesion remains the limiting factor. Using sequence-specific endonucleases that cleave only one strand of DNA on a double-stranded DNA substrate, we prepared large quantities of plasmid DNA with a specific lesion. We compared the kinetic features of BER using plasmid and oligonucleotide substrates containing the same lesion and strategic restriction sites around the lesion. The K(m) for plasmid DNA substrate was slightly higher than that for the oligonucleotide substrate, while the V(max) of BER product formation for the plasmid and oligonucleotide substrates was similar. The catalytic efficiency of BER with the oligonucleotide substrate was slightly higher than that with the plasmid substrate. We conclude that there were no significant differences in the catalytic efficiency of in vitro BER measured with plasmid and oligonucleotide substrates. Analysis of the ratio of SN BER to LP BER was addressed using cellular extracts and a novel plasmid substrate.


Figures
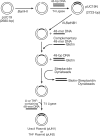
Figure 1.
Figure 1.
Construction of lesion-specific plasmid substrates. Lesion-specific plasmid substrates for in vitro BER assays, pUN1 and pUN2, were constructed as described under ‘Materials and Methods section’. The pUC19 was cut with BamHI and a 43-bp fragment was inserted to create pUC19N that contained two N.BstNB1 sites. Then, the pUC19N was digested with N.BstNB1 to generate a 48-nt gap. The 48-nt fragment was removed by hybridization to a biotinylated-tagged complementary oligonucleotide and followed by adsorption onto streptavidin-coated magnetic beads. Next, the plasmid, pUN1 or pUN2, was created by re-hybridization and ligation of gapped pUC19N to the 5′-phosphorylated 48-mer oligonucleotide containing either uracil or THF, respectively, as shown.
Figure 2.
Figure 2.
Schematic representation of plasmid and oligonucleotide DNA substrates. (A) Sequence of the uracil-containing fragment of pUN1 and restriction sites are shown. After the repair reaction, DNA products were restricted with the indicated enzymes, and fragments were separated by 20% denaturing PAGE. DNA fragment sizes and descriptions of DNA synthesis products are indicated. (B) The sequence of 55-bp oligonucleotide containing uracil at position 32 and a strategic restriction site is shown. The sequence of the oligonucleotide substrate is identical to the 41-mer fragment of plasmid in (A). DNA fragment sizes and descriptions of DNA synthesis products are indicated.
Figure 3.
Figure 3.
Comparison of BER reaction products using plasmid and oligonucleotide substrates. In order to compare the BER reaction products using plasmid-based or oligonucleotide-based assay, the repair reaction was performed with lesion-specific DNA substrate, as indicted at the top of each panel, and BTNE. The reaction conditions and product analyses were as described under ‘Materials and Methods’ section. Panels (AD), BER reaction was performed in a 10 μl reaction mixture that contained 50 nM plasmid/oligonucleotide DNA (uracil- or THF-containing DNA) and 10 μg BTNE. Incubation was for 30 min at 37°C. The reaction products were purified, digested with the indicated restriction enzyme (s), and then separated by 20% denaturing PAGE. Panels (A) and (B) show the total BER products represented by 41-mer and 55-mer DNA fragments obtained with uracil or THF-containing plasmid, pUN1 or pUN2, and oligonucleotide substrates, respectively. The 25-mer and 32-mer DNA fragments observed with plasmid and oligonucleotide substrates, respectively, represented unligated or stalled intermediates. Panels (C) and (D), the remaining reaction products in (A) and (B) were digested with KpnI or KpnI plus XhoI (Panel C), and XhoI (Panel D), respectively. This resulted in 25-mer (SN BER) and 16-mer (LP BER) DNA fragments from plasmid substrate and 32-mer (SN BER) and 23-mer (LP BER) DNA fragments from oligonucleotide substrate, respectively. In cases where unligated or stalled intermediates were observed (i.e. the 25-mer and 32-mer fragments), the counts in these molecules were considered as background and subtracted for the calculation of SN BER. The positions of total BER, SN BER/stalled and LP BER products are indicated.
Figure 4.
Figure 4.
Steady-state kinetic analysis of the repair reaction using plasmid and oligonucleotide substrates. The reaction conditions and products analyses were as described under ‘Materials and Methods section’. Repair reaction was performed under conditions of substrate excess with BTNE using either uracil-containing plasmid (open circle) or uracil-containing oligonucleotide (closed circle) substrate. The concentrations of plasmid and oligonucleotide substrates were 450 nM and 200 nM, respectively. Aliquots were taken at the indicated time intervals, and the DNA products were analyzed as in Figure 3. Time courses of product formation for the plasmid and oligonucleotide substrates are shown. BER products were quantified with ImageQuant software, and the data were fitted to a straight-line equation. The initial rates of BTNE-mediated BER for the plasmid and oligonucleotide substrates were 0.67 and 1.85 fmol dCMP incorporated/min, respectively. The experiments were repeated three times, and a representative graph from one experiment is shown.
Figure 5.
Figure 5.
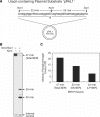
Assessment of the ratio of SN to LP BER after repair incubation. (A) Schematic diagram of uracil-containing plasmid, ‘pPAL1’, is shown. A uracil residue (U) was placed in a central position of the NcoI/SacI fragment. Three strategic restriction enzyme sites, NcoI, KpnI and SacI, were designed around the lesion such that SN and LP BER could be analyzed in the same repair reaction mixture. After completion of the BER reaction in the presence of [α-32P]dCTP, repair products were restricted with either NcoI and SacI or NcoI, SacI and KpnI, which generated 47-, 25- and 22-mer DNA fragments representing total, LP and SN BER products, respectively. To calculate SN and LP BER products, counts in the 25-mer fragment were subtracted from the total counts in 22-mer fragment, because for every incorporation of dCMP at the second position, next to uracil, one dCMP will be incorporated first at the lesion site. (B) pPAL1 (20 nM) was incubated with 10 μg of MEF extract in 50 mM Tris–HCl, pH 7.5, 5 mM MgCl2, 20 mM NaCl and 1 mM DTT. The reaction was conducted at 37°C for 30 min in the presence of 20 μM each of dATP, dGTP, dTTP and 2.3 μM [α-32P]dCTP. A 16-mer radiolabeled DNA fragment was added in each reaction mixture as an internal control prior to phenol/chloroform extraction and ethanol precipitation. The reaction products were analyzed by 15% denaturing PAGE. The combinations of restriction enzymes used are shown at top of the PhosphorImager panel. The description of each radiolabeled band is indicated on the right-hand side of the image. (C) Quantification of total, SN and LP BER is shown in a bar graph. Band intensity of each radiolabeled DNA fragment, 47-, 25- and 22-mer, was measured in terms of arbitrary PhosphorImager units and plotted as total BER, SN BER and LP BER. The experiments were repeated three times and a PhosphorImage of a representative experiment is shown.
Figure 6.
Figure 6.
Incorporation of labeled dCMP and dTMP into the repair patch produced during LP BER of the THF-containing plasmid. The repair reaction was performed with THF-containing plasmid, pUN2 and MEF extract. The reaction conditions and product analyses were as described under ‘Materials and Methods section’. (A) BER reaction was performed in a10 μl reaction mixture that contained 20 nM pUN2, 10 μg MEF extract and either 32P-dCTP (lanes 1and 2) or 32P-dTTP (lanes 3 and 4). Incubation was for 30 min at 37°C. The reaction products were analyzed as in Figure 3. The restriction enzymes used are shown at the top of the PhosphorImager panel. The description of each radiolabeled band is indicated on both sides of the image. (B) Quantification of total BER (41-mer), SN BER (25-mer) and LP BER (16-mer) is shown in a bar graph. A small portion of each reaction was spotted on the gel filter for calculations of incorporation of 32P-dCMP or 32P-dTMP in DNA. The band intensity of each radiolabeled DNA fragment, 41-, 25- and 16-mer, was measured in terms of arbitrary PhosphorImager units and then converted into relative dCMP or dTMP incorporation. The experiments were repeated three times, and the PhosphorImage of a representative experiment is shown. (C) The positions of dCMP (filled circle) or dTMP (cross) incorporation in the 41-, 25- and 16-mer fragments, and the restriction sites are indicated.
Figure 7.
Figure 7.
Restriction analysis and quantification of dCMP incorporation into the repair patch produced during LP BER in MEF extract. The repair reaction was performed with THF-containing plasmid, pUN2 and MEF extract. (A) BER reaction was performed in a 10 μl reaction mixture that contained 20 nM pUN2, 10 μg MEF extract, and 32P-dCTP. Incubation was for 30 min at 37°C. The reaction products were analyzed as in Figure 3. The restriction enzymes used are shown at the top of the PhosphorImager panel. The positions of the restricted DNA fragments are indicated on the left-hand side of the image. (B) DNA fragment sizes and description of DNA synthesis products are indicated. Sites of dCMP incorporation (filled circle) in the repair patch are indicated. (C) The incorporation of dCMP (%) in different BER fragments was plotted in a bar diagram. Conversion of arbitrary PhosphorImager units into dCMP incorporation was performed as in Figure 6. The experiments were repeated three times, and the PhosphorImage of a representative experiment is shown.

Similar articles

Cited by

References

    1. Klungland A, Rosewell I, Hollenbach S, Larsen E, Daly G, Epe B, Seeberg E, Lindahl T, Barnes DE. Accumulation of premutagenic DNA lesions in mice defective in removal of oxidative base damage. Proc. Natl Acad. Sci. USA. 1999;96:13300–13305. - PMC - PubMed
    1. Lindahl T. DNA repair enzymes. Annu. Rev. Biochem. 1982;51:61–87. - PubMed
    1. Lindahl T, Wood RD. Quality control by DNA repair. Science. 1999;286:1897–1905. - PubMed
    1. Biade S, Sobol RW, Wilson SH, Matsumoto Y. Impairment of proliferating cell nuclear antigen-dependent apurinic/apyrimidinic site repair on linear DNA. J. Biol. Chem. 1998;273:898–902. - PubMed
    1. Fortini P, Pascucci B, Parlanti E, Sobol RW, Wilson SH, Dogliotti E. Different DNA polymerases are involved in the short- and long-patch base excision repair in mammalian cells. Biochemistry. 1998;37:3575–3580. - PubMed

Publication types