

Nanoparticle-based detection and quantification of DNA with single nucleotide polymorphism (SNP) discrimination selectivity
- PMID: 17720714
- PMCID: PMC2034455
- DOI: 10.1093/nar/gkm602
Nanoparticle-based detection and quantification of DNA with single nucleotide polymorphism (SNP) discrimination selectivity
Abstract
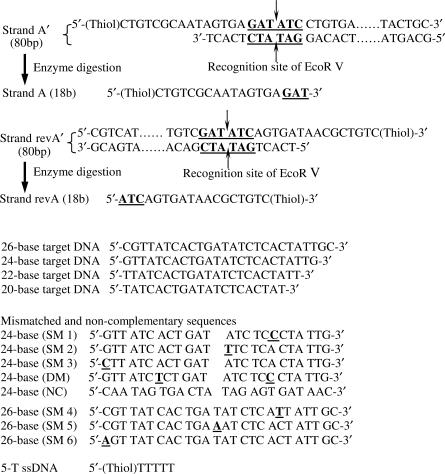
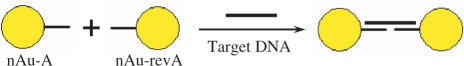
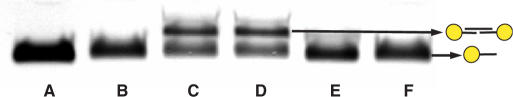
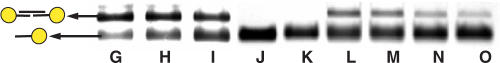
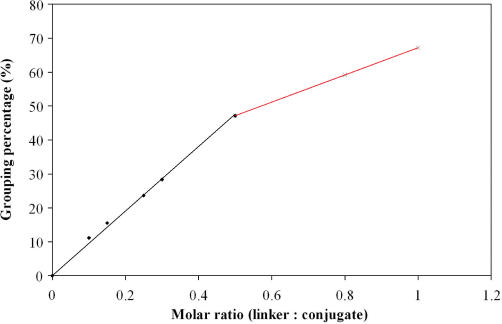
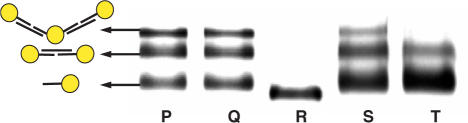
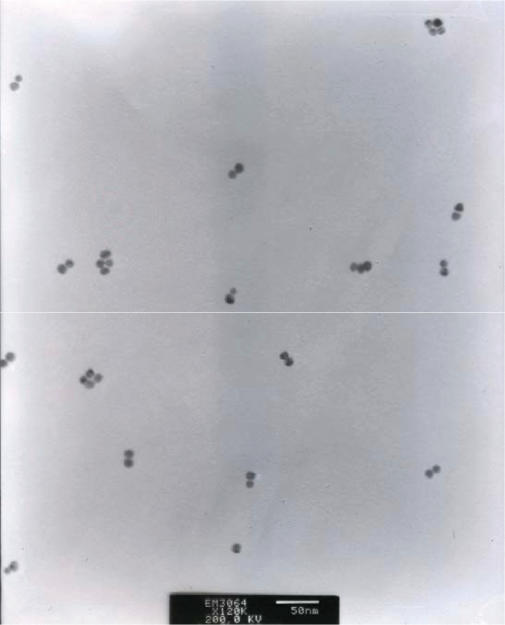
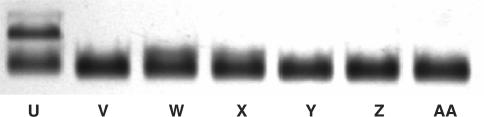
Sequence-specific DNA detection is important in various biomedical applications such as gene expression profiling, disease diagnosis and treatment, drug discovery and forensic analysis. Here we report a gold nanoparticle-based method that allows DNA detection and quantification and is capable of single nucleotide polymorphism (SNP) discrimination. The precise quantification of single-stranded DNA is due to the formation of defined nanoparticle-DNA conjugate groupings in the presence of target/linker DNA. Conjugate groupings were characterized and quantified by gel electrophoresis. A linear correlation between the amount of target DNA and conjugate groupings was found. For SNP detection, single base mismatch discrimination was achieved for both the end- and center-base mismatch. The method described here may be useful for the development of a simple and quantitative DNA detection assay.
Figures

Similar articles
-
Study of single-stranded DNA binding protein-nucleic acids interactions using unmodified gold nanoparticles and its application for detection of single nucleotide polymorphisms.Anal Chem. 2011 Jun 1;83(11):4251-7. doi: 10.1021/ac200525a. Epub 2011 May 9. Anal Chem. 2011. PMID: 21524056
-
DNA Hybridization Assay Using Gold Nanoparticles and Electrophoresis Separation Provides 1 pM Sensitivity.Bioconjug Chem. 2018 Jan 17;29(1):182-189. doi: 10.1021/acs.bioconjchem.7b00682. Epub 2017 Dec 19. Bioconjug Chem. 2018. PMID: 29200266
-
Colorimetric detection of single base-pair mismatches based on the interactions of PNA and PNA/DNA complexes with unmodified gold nanoparticles.Colloids Surf B Biointerfaces. 2019 Sep 1;181:333-340. doi: 10.1016/j.colsurfb.2019.05.069. Epub 2019 May 28. Colloids Surf B Biointerfaces. 2019. PMID: 31154144
-
Well-defined nanoassemblies using gold nanoparticles bearing specific number of DNA strands.Bioconjug Chem. 2008 Jan;19(1):385-90. doi: 10.1021/bc700178f. Epub 2007 Dec 7. Bioconjug Chem. 2008. PMID: 18062658
-
SERS-based approaches toward genetic profiling.Bioanalysis. 2015;7(2):263-78. doi: 10.4155/bio.14.295. Bioanalysis. 2015. PMID: 25587842 Review.
Cited by
-
DNA nanomedicine: Engineering DNA as a polymer for therapeutic and diagnostic applications.Adv Drug Deliv Rev. 2010 Apr 30;62(6):606-16. doi: 10.1016/j.addr.2010.03.004. Epub 2010 Mar 23. Adv Drug Deliv Rev. 2010. PMID: 20338202 Free PMC article. Review.
-
Sensitive Detection of Single-Nucleotide Polymorphisms by Solid Nanopores Integrated With DNA Probed Nanoparticles.Front Bioeng Biotechnol. 2021 Jun 30;9:690747. doi: 10.3389/fbioe.2021.690747. eCollection 2021. Front Bioeng Biotechnol. 2021. PMID: 34277589 Free PMC article.
-
Label free fluorometric characterization of DNA interaction with cholate capped gold nanoparticles using ethidium bromide as a fluorescent probe.J Fluoresc. 2014 Sep;24(5):1397-406. doi: 10.1007/s10895-014-1417-9. Epub 2014 Jun 20. J Fluoresc. 2014. PMID: 24946861
-
Nanotechnology in urology.Urol Clin North Am. 2009 May;36(2):179-88, viii. doi: 10.1016/j.ucl.2009.02.005. Urol Clin North Am. 2009. PMID: 19406319 Free PMC article. Review.
-
The allele-specific probe and primer amplification assay, a new real-time PCR method for fine quantification of single-nucleotide polymorphisms in pooled DNA.Appl Environ Microbiol. 2012 Feb;78(4):1063-8. doi: 10.1128/AEM.06957-11. Epub 2011 Dec 9. Appl Environ Microbiol. 2012. PMID: 22156413 Free PMC article.
References
-
- Patolsky F, Lichtenstein A, Willner I. Detection of single-base DNA mutations by enzyme-amplified electronic transduction. Nat. Biotechnol. 2001;19:253–257. - PubMed
-
- Nam JM, Stoeva SI, Mirkin CA. Bio-bar-code-based DNA detection with PCR-like sensitivity. J. Am. Chem. Soc. 2004;126:5932–5933. - PubMed
-
- Storhoff JJ, Marla SS, Bao P, Hagenow S, Mehta H, Lucas A, Garimella V, Patno T, Buckingham W, et al. Gold nanoparticle-based detection of genomic DNA targets on microarrays using a novel optical detection system. Biosens. Bioelectron. 2004;19:875–883. - PubMed
-
- Alivisatos AP, Johnsson KP, Peng XG, Wilson TE, Loweth CJ, Bruchez MP, Schultz PG. Organization of ‘nanocrystal molecules’ using DNA. Nature. 1996;382:609–611. - PubMed
-
- Mirkin CA, Letsinger RL, Mucic RC, Storhoff JJ. A DNA-based method for rationally assembling nanoparticles into macroscopic materials. Nature. 1996;382:607–609. - PubMed
Publication types
MeSH terms
Substances
LinkOut - more resources
Full Text Sources
Other Literature Sources
