

Effects of hydrophobic surfactant proteins on collapse of pulmonary surfactant monolayers
- PMID: 17720730
- PMCID: PMC2098737
- DOI: 10.1529/biophysj.107.111823
Effects of hydrophobic surfactant proteins on collapse of pulmonary surfactant monolayers
Abstract
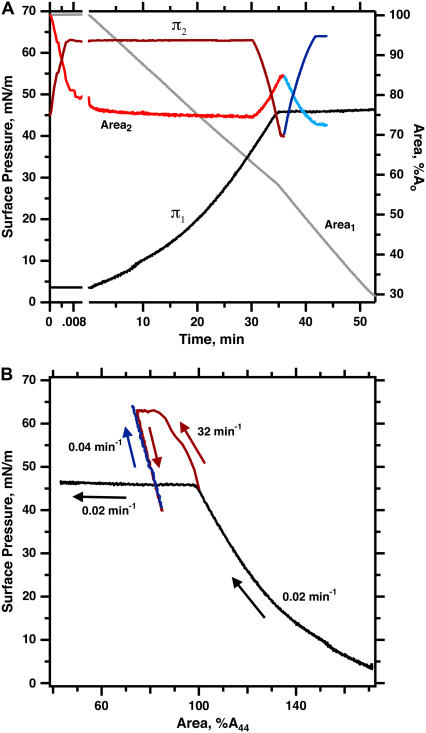
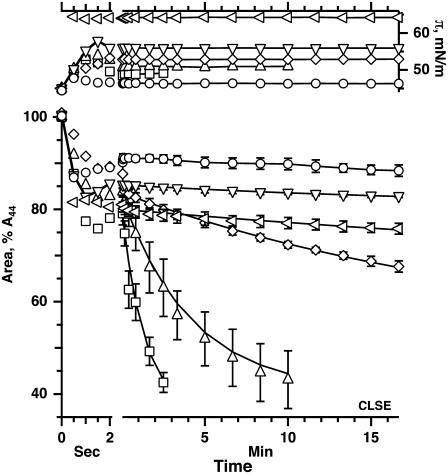
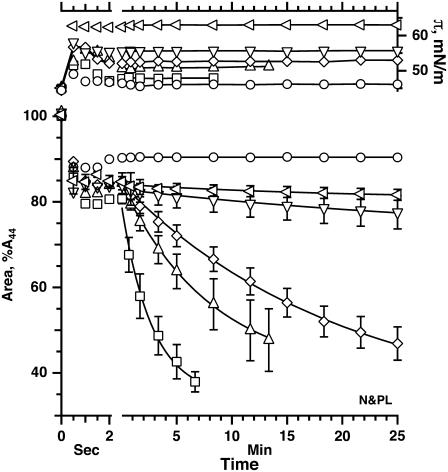
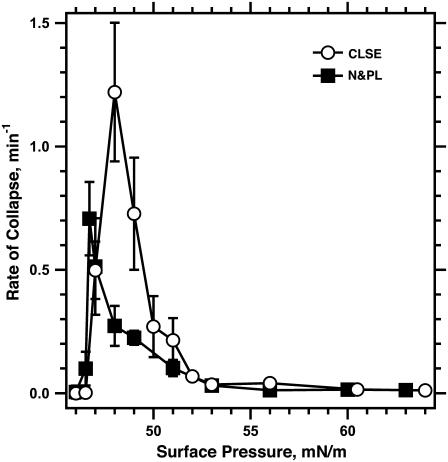
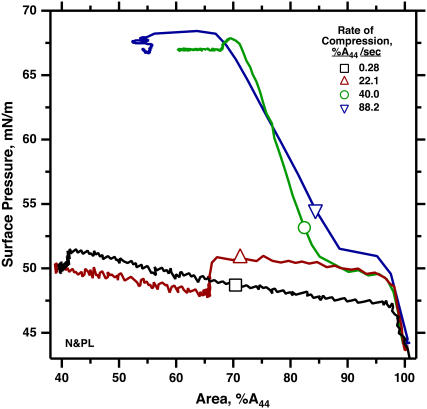
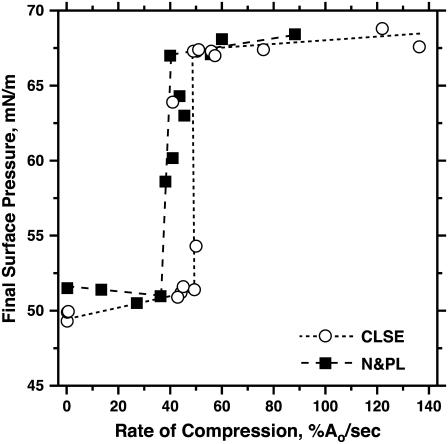
To determine if hydrophobic surfactant proteins affect the stability of pulmonary surfactant monolayers at an air/water interface, the studies reported here compared the kinetics of collapse for the complete set of lipids in calf surfactant with and without the proteins. Monomolecular films spread at the surface of captive bubbles were compressed at 37 degrees C to surface pressures above 46 mN/m, at which collapse first occurred. The rate of area-compression required to maintain a constant surface pressure was measured to directly determine the rate of collapse. For films with and without the proteins, higher surface pressures initially produced faster collapse, but the rates then reached a maximum and decreased to values <0.04 min(-1) above 53 mN/m. The maximum rate for the lipids with the proteins (1.22 +/- 0.28 min(-1)) was almost twice the value for the lipids alone (0.71 +/- 0.15 min(-1)). Because small increments in surface pressure produced large shifts in the rate close to the fastest collapse, compressions at a series of constant speeds also established the threshold rate required to achieve high surface pressure as an indirect indication of the fastest collapse. Both samples produced a sharply defined threshold that occurred at slightly faster compression with the proteins present, supporting the conclusion of the direct measurements that the proteins produce a faster maximum rate of collapse. Our results indicate that at 47-53 mN/m, the hydrophobic surfactant proteins destabilize the compressed monolayers and tend to limit access to the higher surface pressures at which the lipid films become metastable.
Figures
Similar articles
-
Metastability of a supercompressed fluid monolayer.Biophys J. 2003 Nov;85(5):3048-57. doi: 10.1016/S0006-3495(03)74723-7. Biophys J. 2003. PMID: 14581205 Free PMC article.
-
The collapse of monolayers containing pulmonary surfactant phospholipids is kinetically determined.Biophys J. 2005 Jul;89(1):306-14. doi: 10.1529/biophysj.105.060947. Biophys J. 2005. PMID: 15985424 Free PMC article.
-
Cholesterol modifies the properties of surface films of dipalmitoylphosphatidylcholine plus pulmonary surfactant-associated protein B or C spread or adsorbed at the air-water interface.Biochemistry. 1997 Jan 28;36(4):912-22. doi: 10.1021/bi9623542. Biochemistry. 1997. PMID: 9020791
-
Protein-lipid interactions and surface activity in the pulmonary surfactant system.Chem Phys Lipids. 2006 Jun;141(1-2):105-18. doi: 10.1016/j.chemphyslip.2006.02.017. Epub 2006 Mar 20. Chem Phys Lipids. 2006. PMID: 16600200 Review.
-
Pulmonary surfactant and drug delivery: Focusing on the role of surfactant proteins.J Control Release. 2018 Dec 10;291:116-126. doi: 10.1016/j.jconrel.2018.10.012. Epub 2018 Oct 12. J Control Release. 2018. PMID: 30321577 Review.
Cited by
-
Burkholderia mallei and Burkholderia pseudomallei stimulate differential inflammatory responses from human alveolar type II cells (ATII) and macrophages.Front Cell Infect Microbiol. 2012 Dec 28;2:165. doi: 10.3389/fcimb.2012.00165. eCollection 2012. Front Cell Infect Microbiol. 2012. PMID: 23293773 Free PMC article.
-
An anionic phospholipid enables the hydrophobic surfactant proteins to alter spontaneous curvature.Biophys J. 2013 Feb 5;104(3):594-603. doi: 10.1016/j.bpj.2012.12.041. Biophys J. 2013. PMID: 23442910 Free PMC article.
-
Pulmonary surfactant: an immunological perspective.Cell Physiol Biochem. 2010;25(1):13-26. doi: 10.1159/000272047. Epub 2009 Dec 22. Cell Physiol Biochem. 2010. PMID: 20054141 Free PMC article. Review.
-
Environmental tobacco smoke effects on lung surfactant film organization.Biochim Biophys Acta. 2009 Feb;1788(2):358-70. doi: 10.1016/j.bbamem.2008.11.021. Epub 2008 Dec 11. Biochim Biophys Acta. 2009. PMID: 19118518 Free PMC article.
-
The biophysical function of pulmonary surfactant.Respir Physiol Neurobiol. 2008 Nov 30;163(1-3):244-55. doi: 10.1016/j.resp.2008.05.018. Epub 2008 Jul 16. Respir Physiol Neurobiol. 2008. PMID: 18632313 Free PMC article. Review.
References
-
- Horie, T., and J. Hildebrandt. 1971. Dynamic compliance, limit cycles, and static equilibria of excised cat lung. J. Appl. Physiol. 31:423–430. - PubMed
-
- Wilson, T. A. 1981. Relations among recoil pressure, surface area, and surface tension in the lung. J. Appl. Physiol. 50:921–930. - PubMed
-
- Schürch, S. 1982. Surface tension at low lung volumes: dependence on time and alveolar size. Respir. Physiol. 48:339–355. - PubMed
-
- Valberg, P. A., and J. D. Brain. 1977. Lung surface tension and air space dimensions from multiple pressure-volume curves. J. Appl. Physiol. 43:730–738. - PubMed
-
- Smith, J. C., and D. Stamenovic. 1986. Surface forces in lungs. I. Alveolar surface tension-lung volume relationships. J. Appl. Physiol. 60:1341–1350. - PubMed
Publication types
MeSH terms
Substances
Grants and funding
LinkOut - more resources
Full Text Sources
Miscellaneous
