Role of sigma factors in controlling global gene expression in light/dark transitions in the cyanobacterium Synechocystis sp. strain PCC 6803
- PMID: 17720783
- PMCID: PMC2168720
- DOI: 10.1128/JB.01036-07
Role of sigma factors in controlling global gene expression in light/dark transitions in the cyanobacterium Synechocystis sp. strain PCC 6803
Abstract
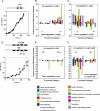
We report on differential gene expression in the cyanobacterium Synechocystis sp. strain PCC 6803 after light-dark transitions in wild-type, DeltasigB, and DeltasigD strains. We also studied the effect of day length in the presence of glucose on a DeltasigB DeltasigE mutant. Our results indicated that the absence of SigB or SigD predominately altered gene expression in the dark or in the light, respectively. In the light, approximately 350 genes displayed transcript levels in the DeltasigD strain that were different from those of the wild type, with over 200 of these up-regulated in the mutant. In the dark, removal of SigB altered more than 150 genes, and the levels of 136 of these were increased in the mutant compared to those in the wild type. The removal of both SigB and SigE had a major impact on gene expression under mixotrophic growth conditions and resulted in the inability of cells to grow in the presence of glucose with 8-h light and 16-h dark cycles. Our results indicated the importance of group II sigma factors in the global regulation of transcription in this organism and are best explained by using the sigma cycle paradigm with the stochastic release model described previously (R. A. Mooney, S. A. Darst, and R. Landick, Mol. Cell 20:335-345, 2005). We combined our results with the total protein levels of the sigma factors in the light and dark as calculated previously (S. Imamura, S. Yoshihara, S. Nakano, N. Shiozaki, A. Yamada, K. Tanaka, H. Takahashi, M. Asayama, and M. Shirai, J. Mol. Biol. 325:857-872, 2003; S. Imamura, M. Asayama, H. Takahashi, K. Tanaka, H. Takahashi, and M. Shirai, FEBS Lett. 554:357-362, 2003). Thus, we concluded that the control of global transcription is based on the amount of the various sigma factors present and able to bind RNA polymerase.
Figures


Similar articles
-
Cooperation of group 2 sigma factors, SigD and SigE for light-induced transcription in the cyanobacterium Synechocystis sp. PCC 6803.FEBS Lett. 2007 Apr 3;581(7):1495-500. doi: 10.1016/j.febslet.2007.03.010. Epub 2007 Mar 13. FEBS Lett. 2007. PMID: 17379215
-
The heat shock response in the cyanobacterium Synechocystis sp. Strain PCC 6803 and regulation of gene expression by HrcA and SigB.Arch Microbiol. 2006 Oct;186(4):273-86. doi: 10.1007/s00203-006-0138-0. Epub 2006 Jul 26. Arch Microbiol. 2006. PMID: 16868740
-
Growth phase-dependent activation of nitrogen-related genes by a control network of group 1 and group 2 sigma factors in a cyanobacterium.J Biol Chem. 2006 Feb 3;281(5):2668-75. doi: 10.1074/jbc.M509639200. Epub 2005 Nov 21. J Biol Chem. 2006. PMID: 16303755
-
Group 2 sigma factor mutant ΔsigCDE of the cyanobacterium Synechocystis sp. PCC 6803 reveals functionality of both carotenoids and flavodiiron proteins in photoprotection of photosystem II.Plant Cell Physiol. 2013 Nov;54(11):1780-90. doi: 10.1093/pcp/pct123. Epub 2013 Sep 4. Plant Cell Physiol. 2013. PMID: 24009334
-
Growth-phase dependent differential gene expression in Synechocystis sp. strain PCC 6803 and regulation by a group 2 sigma factor.Arch Microbiol. 2007 Apr;187(4):265-79. doi: 10.1007/s00203-006-0193-6. Epub 2006 Dec 12. Arch Microbiol. 2007. PMID: 17160677
Cited by
-
Choreography of the transcriptome, photophysiology, and cell cycle of a minimal photoautotroph, prochlorococcus.PLoS One. 2009;4(4):e5135. doi: 10.1371/journal.pone.0005135. Epub 2009 Apr 8. PLoS One. 2009. PMID: 19352512 Free PMC article.
-
Acclimation to high-light conditions in cyanobacteria: from gene expression to physiological responses.J Plant Res. 2012 Jan;125(1):11-39. doi: 10.1007/s10265-011-0454-6. Epub 2011 Oct 18. J Plant Res. 2012. PMID: 22006212 Review.
-
Circadian transcriptional regulation by the posttranslational oscillator without de novo clock gene expression in Synechococcus.Proc Natl Acad Sci U S A. 2011 Sep 13;108(37):15396-401. doi: 10.1073/pnas.1019612108. Epub 2011 Sep 6. Proc Natl Acad Sci U S A. 2011. PMID: 21896749 Free PMC article.
-
Transcriptional Mechanisms of Thermal Acclimation in Prochlorococcus.mBio. 2023 Jun 27;14(3):e0342522. doi: 10.1128/mbio.03425-22. Epub 2023 Apr 13. mBio. 2023. PMID: 37052490 Free PMC article.
-
Expansion and Functional Diversification of TFIIB-Like Factors in Plants.Int J Mol Sci. 2021 Jan 23;22(3):1078. doi: 10.3390/ijms22031078. Int J Mol Sci. 2021. PMID: 33498602 Free PMC article. Review.
References
-
- Aoki, S., T. Kondo, and M. Ishiura. 2002. A promoter-trap vector for clock-controlled genes in the cyanobacterium Synechocystis sp. PCC 6803. J. Microbiol. Methods 49:265-274. - PubMed
-
- Asayama, M. 2006. Regulatory system for light-responsive gene expression in photosynthesizing bacteria: cis-elements and trans-acting factors in transcription and post-transcription. Biosci. Biotechnol. Biochem. 70:565-573. - PubMed
-
- Asayama, M., S. Imamura, S. Yoshihara, A. Miyazaki, N. Yoshida, T. Sazuka, T. Kaneko, O. Ohara, S. Tabata, T. Osanai, K. Tanaka, H. Takahashi, and M. Shirai. 2004. SigC, the group 2 sigma factor of RNA polymerase, contributes to the late-stage gene expression and nitrogen promoter recognition in the cyanobacterium Synechocystis sp. strain PCC 6803. Biosci. Biotechnol. Biochem. 68:477-487. - PubMed
-
- Benjamini, Y., and Y. Hochberg. 1995. Controlling the false discovery rate—a practical and powerful approach to multiple testing. J. R. Stat. Soc. B. 57:289-300.
Publication types
MeSH terms
Substances
LinkOut - more resources
Full Text Sources

