

Microarray-based characterization of the Listeria monocytogenes cold regulon in log- and stationary-phase cells
- PMID: 17720827
- PMCID: PMC2075049
- DOI: 10.1128/AEM.00897-07
Microarray-based characterization of the Listeria monocytogenes cold regulon in log- and stationary-phase cells
Abstract
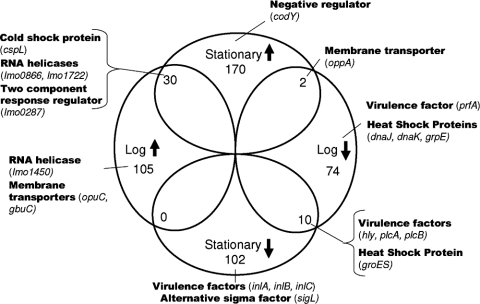
Whole-genome microarray experiments were performed to define the Listeria monocytogenes cold growth regulon and to identify genes differentially expressed during growth at 4 and 37 degrees C. Microarray analysis using a stringent cutoff (adjusted P < 0.001; >/=2.0-fold change) revealed 105 and 170 genes that showed higher transcript levels in logarithmic- and stationary-phase cells, respectively, at 4 degrees C than in cells grown at 37 degrees C. A total of 74 and 102 genes showed lower transcript levels in logarithmic- and stationary-phase cells, respectively, grown at 4 degrees C. Genes with higher transcript levels at 4 degrees C in both stationary- and log-phase cells included genes encoding a two-component response regulator (lmo0287), a cold shock protein (cspL), and two RNA helicases (lmo0866 and lmo1722), whereas a number of genes encoding virulence factors and heat shock proteins showed lower transcript levels at 4 degrees C. Selected genes that showed higher transcript levels at 4 degrees C during both stationary and log phases were confirmed by quantitative reverse transcriptase PCR. Our data show that (i) a large number of L. monocytogenes genes are differentially expressed at 4 and 37 degrees C, with more genes showing higher transcript levels than lower transcript levels at 4 degrees C, (ii) L. monocytogenes genes with higher transcript levels at 4 degrees C include a number of genes and operons with previously reported or plausible roles in cold adaptation, and (iii) L. monocytogenes genes with lower transcript levels at 4 degrees C include a number of virulence and virulence-associated genes as well as some heat shock genes.
Figures


Similar articles
-
Listeria monocytogenes grown at 7° C shows reduced acid survival and an altered transcriptional response to acid shock compared to L. monocytogenes grown at 37° C.Appl Environ Microbiol. 2012 Jun;78(11):3824-36. doi: 10.1128/AEM.00051-12. Epub 2012 Mar 23. Appl Environ Microbiol. 2012. PMID: 22447604 Free PMC article.
-
Contributions of six lineage-specific internalin-like genes to invasion efficiency of Listeria monocytogenes.Foodborne Pathog Dis. 2009 Jan-Feb;6(1):57-70. doi: 10.1089/fpd.2008.0140. Foodborne Pathog Dis. 2009. PMID: 19014275
-
SigmaB-dependent and sigmaB-independent mechanisms contribute to transcription of Listeria monocytogenes cold stress genes during cold shock and cold growth.Appl Environ Microbiol. 2007 Oct;73(19):6019-29. doi: 10.1128/AEM.00714-07. Epub 2007 Aug 3. Appl Environ Microbiol. 2007. PMID: 17675428 Free PMC article.
-
Salt stress-induced transcription of σB- and CtsR-regulated genes in persistent and non-persistent Listeria monocytogenes strains from food processing plants.Foodborne Pathog Dis. 2012 Mar;9(3):198-206. doi: 10.1089/fpd.2011.1000. Epub 2012 Jan 4. Foodborne Pathog Dis. 2012. PMID: 22216988
-
A postgenomic appraisal of osmotolerance in Listeria monocytogenes.Appl Environ Microbiol. 2003 Jan;69(1):1-9. doi: 10.1128/AEM.69.1.1-9.2003. Appl Environ Microbiol. 2003. PMID: 12513970 Free PMC article. Review. No abstract available.
Cited by
-
Comparative analysis of the sigma B-dependent stress responses in Listeria monocytogenes and Listeria innocua strains exposed to selected stress conditions.Appl Environ Microbiol. 2008 Jan;74(1):158-71. doi: 10.1128/AEM.00951-07. Epub 2007 Nov 16. Appl Environ Microbiol. 2008. PMID: 18024685 Free PMC article.
-
Proteomic analysis of cross protection provided between cold and osmotic stress in Listeria monocytogenes.J Proteome Res. 2014 Apr 4;13(4):1896-904. doi: 10.1021/pr401004a. Epub 2014 Mar 5. J Proteome Res. 2014. PMID: 24564473 Free PMC article.
-
Comparison of genetic variations between high- and low-risk Listeria monocytogenes isolates using whole-genome de novo sequencing.Front Microbiol. 2023 Jul 18;14:1163841. doi: 10.3389/fmicb.2023.1163841. eCollection 2023. Front Microbiol. 2023. PMID: 37533826 Free PMC article.
-
Cold-Shock Domain Family Proteins (Csps) Are Involved in Regulation of Virulence, Cellular Aggregation, and Flagella-Based Motility in Listeria monocytogenes.Front Cell Infect Microbiol. 2017 Oct 26;7:453. doi: 10.3389/fcimb.2017.00453. eCollection 2017. Front Cell Infect Microbiol. 2017. PMID: 29124040 Free PMC article.
-
Reassessment of the Listeria monocytogenes pan-genome reveals dynamic integration hotspots and mobile genetic elements as major components of the accessory genome.BMC Genomics. 2013 Jan 22;14:47. doi: 10.1186/1471-2164-14-47. BMC Genomics. 2013. PMID: 23339658 Free PMC article.
References
-
- Anderson, K. L., C. Roberts, T. Disz, V. Vonstein, K. Hwang, R. Overbeek, P. D. Olson, S. J. Projan, and P. M. Dunman. 2006. Characterization of the Staphylococcus aureus heat shock, cold shock, stringent, and SOS responses and their effects on log-phase mRNA turnover. J. Bacteriol. 188:6739-6756. - PMC - PubMed
Publication types
MeSH terms
Substances
Associated data
- Actions
Grants and funding
LinkOut - more resources
Full Text Sources
Molecular Biology Databases
