. 2007 Dec 1;110(12):3978-84.
doi: 10.1182/blood-2007-05-091306. Epub 2007 Aug 24.

Proapoptotic BH3-only protein Bim is essential for developmentally programmed death of germinal center-derived memory B cells and antibody-forming cells

Affiliations

Proapoptotic BH3-only protein Bim is essential for developmentally programmed death of germinal center-derived memory B cells and antibody-forming cells

Silke F Fischer et al. Blood. .

Abstract

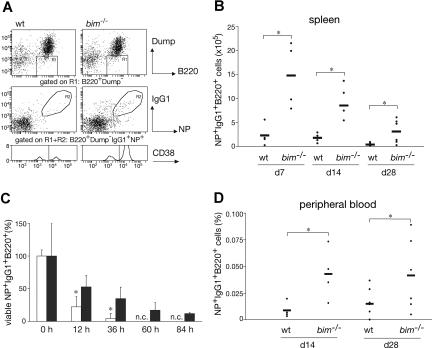
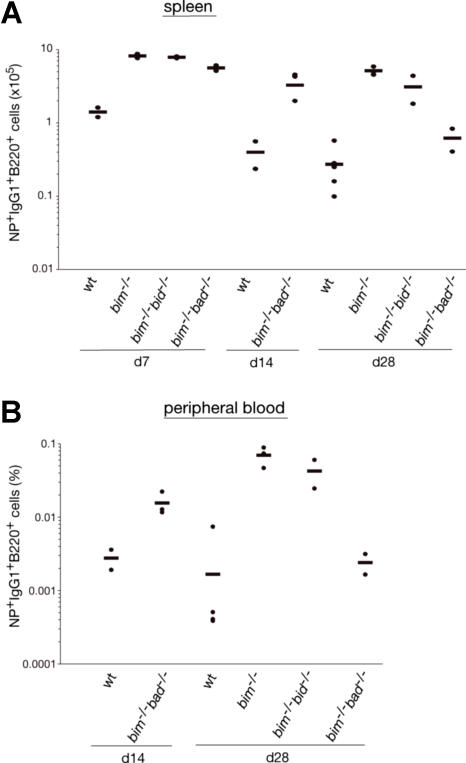
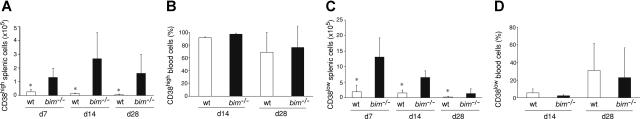
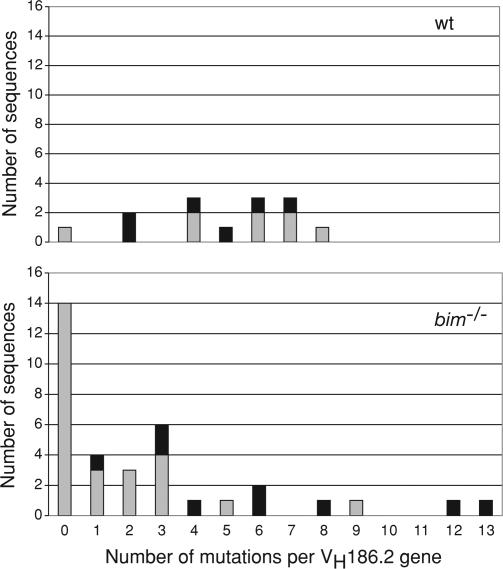
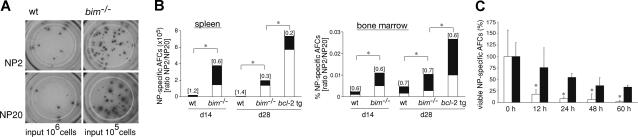
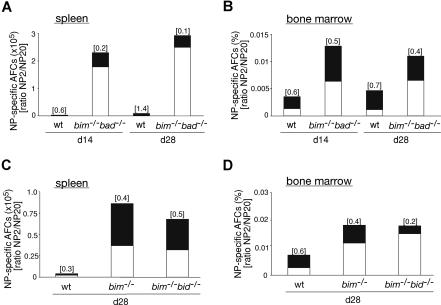
T cell-dependent B-cell immune responses induce germinal centers that are sites for expansion, diversification, and selection of antigen-specific B cells. During the immune response, antigen-specific B cells are removed in a process that favors the retention of cells with improved affinity for antigen, a cell death process inhibited by excess Bcl-2. In this study, we examined the role of the BH3-only protein Bim, an initiator of apoptosis in the Bcl-2-regulated pathway, in the programmed cell death accompanying an immune response. After immunization, Bim-deficient mice showed persistence of both memory B cells lacking affinity-enhancing mutations in their immunoglobulin genes and antibody-forming cells secreting low-affinity antibodies. This was accompanied by enhanced survival of both cell types in culture. We have identified for the first time the physiologic mechanisms for killing low-affinity antibody-expressing B cells in an immune response and have shown this to be dependent on the BH3-only protein Bim.


Figures

Figure 1
Figure 1
Bim-deficiency led to prolonged survival and abnormal accumulation of antigen-specific B cells. Mice (wt and bim−/−) were injected intraperitoneally with 100 μg of NP coupled to KLH; 28 days later, leukocytes were collected from the spleen and stained with the indicated antibodies and analyzed by flow cytometry. (A) Viable cells were gated on dump-channel negative (IgMIgDGr-1Mac-1) and B220+ cells (R1). Among the cells in R1, those that had switched isotype to IgG1 and possessed the ability to bind the immunizing hapten NP coupled to the fluorescent protein allophycocyanin (APC) result in a population of antigen-specific IgG1+NP+ B cells (R2). These gated cells (R1R2) were then analyzed for CD38 expression to discriminate between memory (CD38high) and GC B cells (CD38low). The total numbers of antigen-specific IgG1+NP+ B cells in the spleen (B) and their percentages in blood (D) were determined as illustrated in (A). Data represent the mean (± SD) of n = 4 to 8 mice; (*P ≤ .05). (C) B220+ enriched B cells from immunized wt (□) and bim−/− (■) mice were cultured for the indicated times in simple medium, harvested, and stained to enumerate antigen-specific IgG1+NP+ B cells as shown in (A). The initial number of viable IgG1+NP+ B cells at time 0 h was set as 100%, and the proportion of viable cells remaining after the different times in culture is displayed (n.c. = no cells). Data represent means (± SD) of n = 3 mice. (*P < .02).
Figure 2
Figure 2
Bad- or Bid-deficiency did not further enhance the abnormal accumulation of antigen-specific B cells in bim−/− mice. Mice (wt, bim−/−, bim−/−bad−/−, or bim−/−bid−/−) were injected intraperitoneally with 100 μg of NP coupled to KLH, and leukocytes were collected from the spleen after 7, 14, and 28 days. Cells were stained with fluorochrome-conjugated surface marker-specific monoclonal antibodies and gated on IgMIgDGr-1Mac-1 cells by flow cytometry and analyzed for their proportion of antigen-specific B220+IgG1+NP+ B cells as illustrated in Figure 1A. The total numbers of antigen-specific IgG1+NP+ B cells in the spleen of bim−/−bad−/− and bim−/−bid−/− (A) were determined, and their percentages in the peripheral blood are also shown (B). Each data point represents a mouse: n = 2-3 bim−/−bad−/− mice, n = 2 bim−/−bid−/− mice, n = 3 bim−/−, and n = 3 wt mice.
Figure 3
Figure 3
Bim-deficient mice accumulated abnormally increased numbers of memory B cells. Wild-type and bim−/− mice were immunized with NP. Spleen cells were harvested after 7, 14, and 28 days and analyzed for their content of IgMIgDGr-1Mac-1B220+IgG1+NP+ B cells by flow cytometry (as in Figure 1A). Within this cell population, cells with a memory phenotype (CD38high) and GC phenotype (CD38low) were quantified by FACS analysis (as in Figure 1A). The total numbers of memory B cells in the spleen (A; *P < .05), percentages of memory B cells in the blood (B), total numbers of GC B cells in the spleen (C; *P ≤ .05) and the percentages of GC B cells in the blood (D) are indicated. Data represent the mean (± SD) of n = 4 to 8 mice.
Figure 4
Figure 4
Abnormal persistence of memory B cells with no or only few VH186.2 gene somatic mutations in bim−/− mice. Wild-type and bim−/− mice were immunized with NP-KLH, and after 28 days, single antigen-specific IgG1+NP+ B cells with a memory B cell phenotype (CD38high) were sorted by flow cytometry. The cDNAs of the VH186.2 genes of these cells were amplified by PCR, sequenced, and the frequencies of mutations in wt and bim−/− B cells determined by comparison with the germ-line VH186.2 gene sequence. Distribution of somatic mutations in the VH186.2 genes of wt and bim−/− cells. Column height represents the total number of sequences, and the black portion indicates sequences with mutations giving rise to a tryptophan to leucine exchange at amino acid position 33 (W33L), which is known to lead to enhanced affinity for NP.
Figure 5
Figure 5
Bim-deficient mice accumulated abnormal numbers of AFCs but still only recruited high-affinity AFCs into the bone marrow. Wild-type and bim−/− mice were immunized with NP-KLH. After 14 or 28 days, spleen and bone marrow were harvested and ELISPOT assays performed to determine the numbers of NP-specific AFCs. (A) The picture shows the total of all IgG1+ NP-specific AFCs (high and low affinity; ie, antibodies capable of binding to NP20) and the high-affinity (ie, antibodies capable of binding to NP2 but not NP20) IgG1+ NP-specific AFCs from the spleen (note: wt input, 106 cells; bim−/− input, 105 cells). (B) Frequencies of NP-specific IgG1+-secreting AFCs in the spleen (left, total cell number) and bone marrow (right, percentage) of wt, bim−/−, and bcl-2 transgenic mice. The total column represents all AFCs (high plus low affinity; ie, binding to NP20) and the high-affinity (antibodies binding to NP2) AFCs are represented by the black proportion of the column. Affinity maturation is calculated as the ratio of NP2/NP20 cells and this is shown on top of each column. Data represent the mean of n = 3 to 9 mice; *P ≤ .008 (spleen) and P ≤ .04 (bone marrow) for both high-affinity and low-affinity anti-NP AFCs. (C) Splenic B cells from NP-KLH immunized wt (white columns) and bim−/− (black columns) mice were cultured in simple medium (no added cytokines) for the indicated times, and ELISPOT assays were performed to enumerate the surviving NP-specific (high-affinity; ie, binding to NP2) AFCs. The number of NP-specific IgG1+ AFCs at time 0 h was set as 100%, and the proportion surviving after the different times in culture is displayed. Data represent mean (± SD) from 4 cultures of 2 mice of each genotype. *P ≤ .02.
Figure 6
Figure 6
Additional loss of Bad or Bid did not further increase the abnormally elevated number of high-affinity AFCs and low-affinity AFCs in Bim-deficient mice. Wt, bim−/−, bim−/−bad−/−, or bim−/−bid−/− mice were immunized with NP coupled to KLH. After 14 or 28 days, spleen and bone marrow were harvested, and ELISPOT assays were performed to determine the numbers of NP-specific AFCs. Frequencies of NP-specific IgG1+-secreting AFCs in the spleen of wt and bim−/−bad−/− mice (A, total cell number) or wt, bim−/− and bim−/−bid−/− mice (C, total cell number) and in the bone marrow (B and D, percentage) were determined. The total numbers of AFCs are represented by the overall height of the column (high- plus low-affinity NP-specific AFCs; ie, binding to NP20) and the high-affinity (antibodies binding to NP2) AFCs are represented by the black proportion of the column. The ratio of NP2/NP20 antibody producing cells indicates the affinity maturation, and this is shown on top of each column. Data represent the mean of n = 2-3 bim−/−bad−/− mice, n = 2 bim−/−bid−/− mice, bim−/− = 3 mice, and n = 3 wt mice.

Similar articles

Cited by

References

    1. Tarlinton D. Germinal centers: form and function. Curr Opin Immunol. 1998;10:245–251. - PubMed
    1. Kelsoe G. Life and death in germinal centers (redux). Immunity. 1996;4:107–111. - PubMed
    1. Lanzavecchia A, Sallusto F. Progressive differentiation and selection of the fittest in the immune response. Nat Rev Immunol. 2002;2:982–987. - PubMed
    1. Blink EJ, Light A, Kallies A, Nutt SL, Hodgkin PD, Tarlinton DM. Early appearance of germinal center-derived memory B cells and plasma cells in blood after primary immunization. J Exp Med. 2005;201:545–554. - PMC - PubMed
    1. Manz RA, Hauser AE, Hiepe F, Radbruch A. Maintenance of serum antibody levels. Annu Rev Immunol. 2005;23:367–386. - PubMed

Publication types

MeSH terms