. 2007 Oct;177(2):1141-50.
doi: 10.1534/genetics.107.076851. Epub 2007 Aug 24.

A genomewide study of reproductive barriers between allopatric populations of a homosporous fern, Ceratopteris richardii

Affiliations

A genomewide study of reproductive barriers between allopatric populations of a homosporous fern, Ceratopteris richardii

Takuya Nakazato et al. Genetics. 2007 Oct.

Abstract

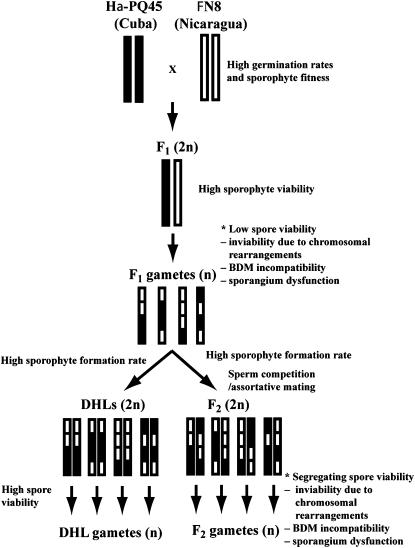
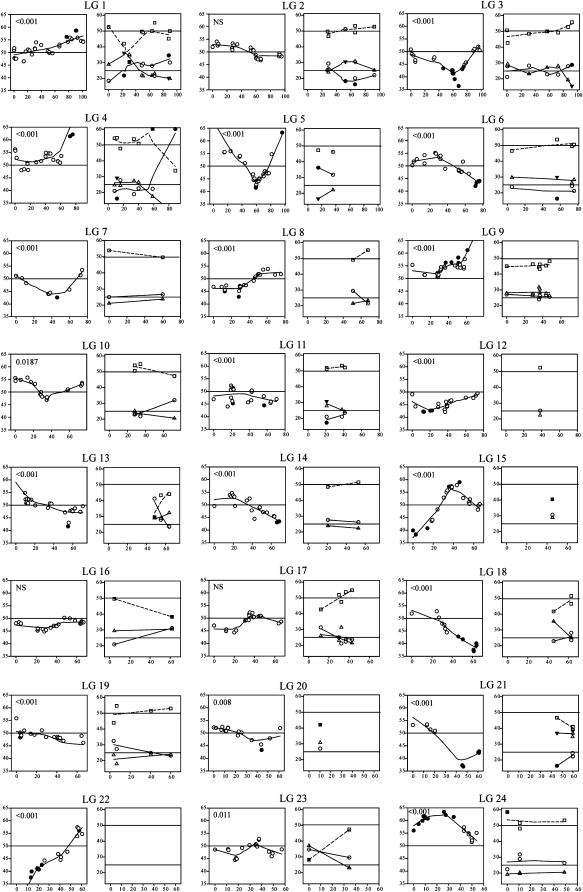
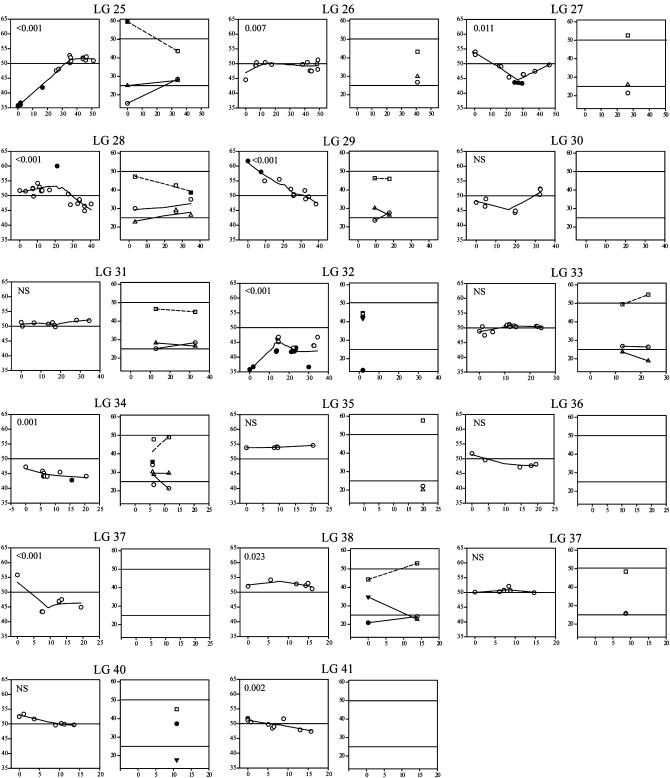
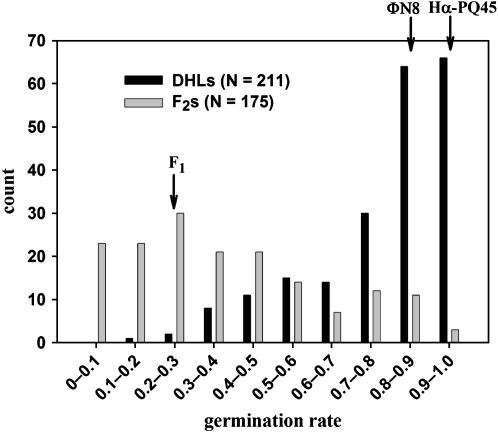
Biological factors involved in reproductive barriers between two divergent races of Ceratopteris richardii were investigated. We used a combination of spore germination rates, QTL analysis of spore germination rates, and transmission ratio distortion (TRD) of 729 RFLPs, AFLPs, and isozyme markers distributed across the genome on the basis of hybrid populations of 488 doubled haploid lines (DHLs) and 168 F(2)'s. Substantial reproductive barriers were found between the parental races, predominantly in the form of spore inviability (23.7% F(1) spore viability). Intrinsic genetic factors such as Bateson-Dobzhansky-Muller (BDM) incompatibilities involving both nuclear-nuclear and nuclear-cytoplasmic factors and chromosomal rearrangements appear to contribute to intrinsic postzygotic isolation. The genomewide distribution patterns of TRD loci support the hypothesis that reproductive barriers are a byproduct of divergence in allopatry and that the strong reproductive barriers are attributable to a small number of genetic elements scattered throughout the genome.


Figures

F<sc>igure</sc> 1.—
Figure 1.—
Illustration of the crossing design for construction of the C. richardii mapping population. Bars with solid and open segments indicate genomic content of Hα-PQ45 and ΦN8 parents, respectively. Reproductive barriers and their possible causes are summarized at asterisks. Sporangium dysfunction refers to problems of sporangium tissues to nurture spores.
F<sc>igure</sc> 2.—
Figure 2.—
TRD along linkage groups for DHLs (left graph of each linkage group) and F2's (right graph of each linkage group). Each data point represents a marker reflecting the percentage of Hα-PQ45 genotypes (circles), ΦN8 genotypes (triangles), and heterozygotes (squares) along the linkage group (x-axis) in centimorgans of genetic distance with significant (solid symbols) or nonsignificant (open symbols) deviation from the expected segregation ratio (horizontal lines) at the α = 0.05. For F2's, the expected Hardy–Weinberg frequency of heterozygotes deviates from 50% depending on the frequencies of the parental genotypes. The likelihood that each linkage group hosts at least one TRD locus (TRDL) is indicated in the left graphs.
F<sc>igure</sc> 3.—
Figure 3.—
Histogram of spore germination rates for DHLs (solid) and F2's (shaded). Arrows indicate the categories of the mean spore germination rates for the parents and the F1.
F<sc>igure</sc> 4.—
Figure 4.—
Significant QTL for spore germination rate on LG4. Top: LOD score along the linkage group with the threshold level indicated by the dashed line. The horizontal bar on top shows the QTL within a 1-LOD margin with percentage of variance explained (PVE) at the peak position indicated on top. Triangles on the x-axis indicate the marker locations. Bottom: Additive genetic variance of the ΦN8 parental allele on the trait along the linkage group.

Similar articles

Cited by

References

    1. Arnold, M. L., and S. A. Hodges, 1995. Are natural hybrids fit or unfit relative to their parents. Trends Ecol. Evol. 10: 67–71. - PubMed
    1. Barbash, D. A., D. F. Siino, A. M. Tarone and J. Roote, 2003. A rapidly evolving MYB-related protein causes species isolation in Drosophila. Proc. Natl. Acad. Sci. USA 100: 5302–5307. - PMC - PubMed
    1. Chevin, L. M., and F. Hospital, 2006. The hitchhiking effect of an autosomal meiotic drive gene. Genetics 173: 1829–1832. - PMC - PubMed
    1. Coyne, J. A., and H. A. Orr, 1989. Two rules of speciation, pp. 180–207 in Speciation and Its Consequences, edited by D. Otte and J. A. Endler. Sinauer Associates, Sunderland, MA.
    1. Coyne, J. A., S. Simeonidis and P. Rooney, 1998. Relative paucity of genes causing inviability in hybrids between Drosophila melanogaster and D. simulans. Genetics 150: 1091–1103. - PMC - PubMed

Publication types