. 2007 Oct;177(2):987-1000.
doi: 10.1534/genetics.107.074948. Epub 2007 Aug 24.

The neutral coalescent process for recent gene duplications and copy-number variants

Affiliations

The neutral coalescent process for recent gene duplications and copy-number variants

Kevin R Thornton. Genetics. 2007 Oct.

Abstract

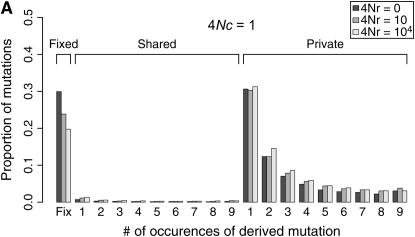
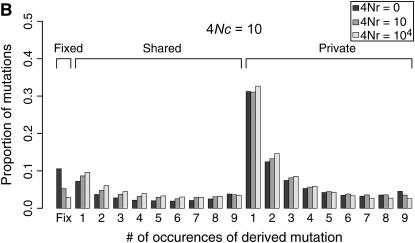
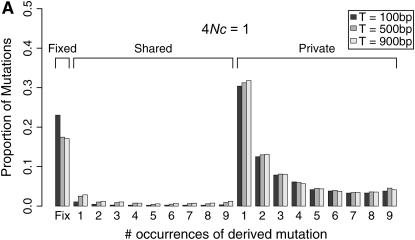
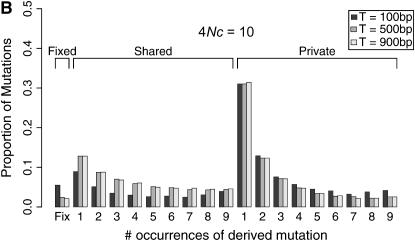
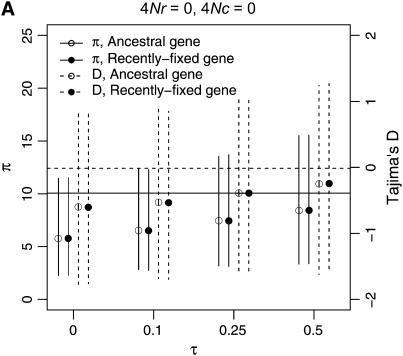
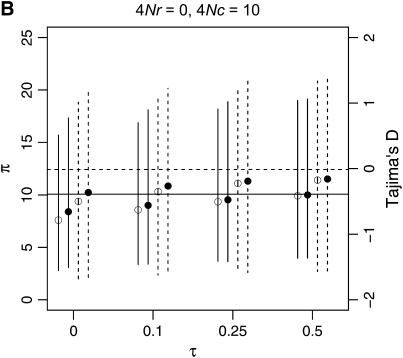
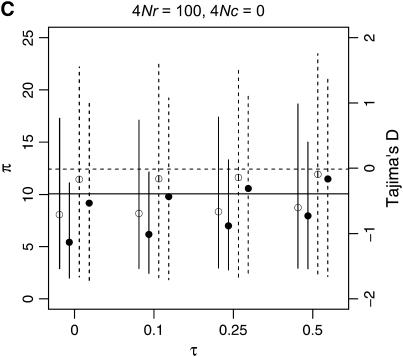
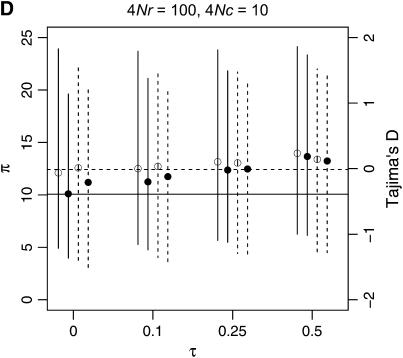
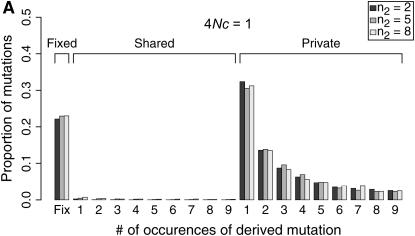
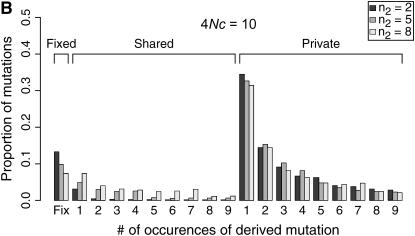
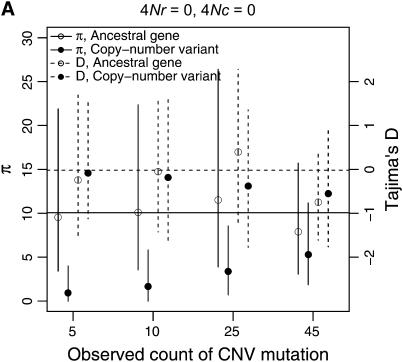
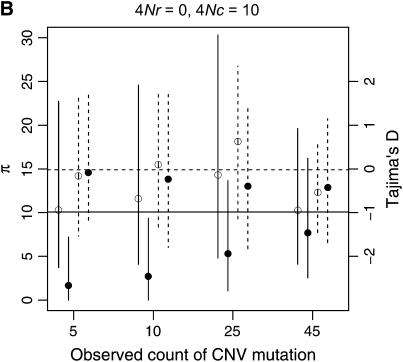
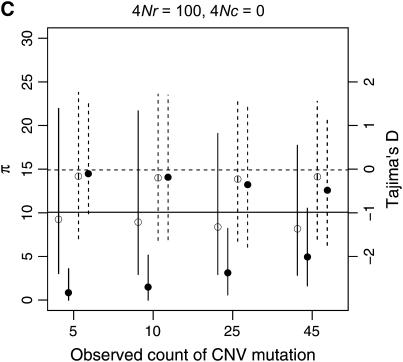
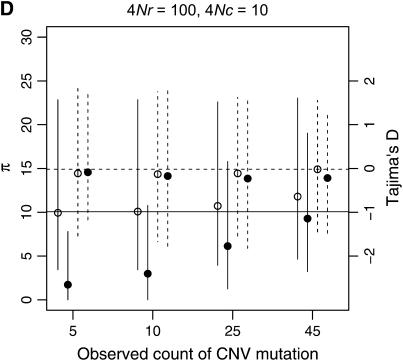
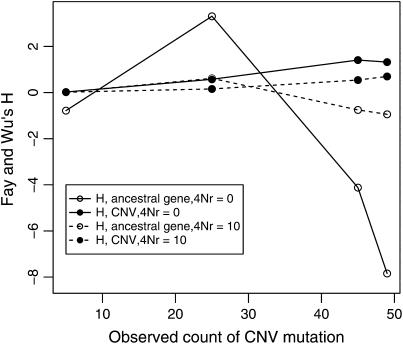
I describe a method for simulating samples from gene families of size two under a neutral coalescent process, for the case where the duplicate gene either has fixed recently in the population or is still segregating. When a duplicate locus has recently fixed by genetic drift, diversity in the new gene is expected to be reduced, and an excess of rare alleles is expected, relative to the predictions of the standard coalescent model. The expected patterns of polymorphism in segregating duplicates ("copy-number variants") depend both on the frequency of the duplicate in the sample and on the rate of crossing over between the two loci. When the crossover rate between the ancestral gene and the copy-number variant is low, the expected pattern of variability in the ancestral gene will be similar to the predictions of models of either balancing or positive selection, if the frequency of the duplicate in the sample is intermediate or high, respectively. Simulations are used to investigate the effect of crossing over between loci, and gene conversion between the duplicate loci, on levels of variability and the site-frequency spectrum.


Figures

F<sc>igure</sc> 1.—
Figure 1.—
Substitution of an allele in a Moran model. Birth events are shown as gray circles and death events as black circles. The time step indicated with an arrow is immediately before a fixation event occurs. At this step, three of the chromosomes share a most recent common ancestor with each other before having a common ancestor with the fourth chromosome. One of these three chromosomes is chosen to reproduce, and the fourth is chosen to die, and a fixation event takes place (all individuals in the next step are descendants of a single reproduction event in the past). The genealogy of the substitution event is shown as dashed lines. This figure is adapted from Tajima (1990).
F<sc>igure</sc> 2.—
Figure 2.—
Example gene genealogies when a neutral substitution has occurred, following Tajima (1990). (A) Genealogy of 2N chromosomes linked to a fixation at time τ = 0. This is essentially a genealogy of 2N + 1 chromosomes with a (1, 2N) partition at the root of the tree. (B) Genealogy of 2N chromosomes linked to a fixation at time τ > 1/2N. This genealogy is a standard coalescent tree until τ, at which point k lineages remain in the population. From τ until the most recent common ancestor of the population, the genealogy comes from the same process as in A.
F<sc>igure</sc> 3.—
Figure 3.—
Example of a gene genealogy for partially linked, duplicated genes. A sample of size n = 4 is followed back to the most recent common ancestor (MRCA) of both genes. Gene B, the recent duplicate, fixed at time τ in the past, and an “A” label represents the ancestral gene. Prior to τ, the genealogical process is the standard coalescent for two partially linked loci. At time τ, the simulation enters a structured coalescent phase, during which there are two types of chromosomes in the history of gene A. First, at any time t during the structured phase, there are chromosomes whose ancestry is in the part of the population ancestral to the duplicate. These are labeled A+. The second type has an ancestry in the portion of the population not containing the duplicate and is labeled A. Crossing over between loci can move chromosomes between these two classes (see simulation). Note that the A+ and A labels are necessary only during the structured phase, where one must keep track of rates of coalescence within subpopulations of different sizes. The MRCA of B is guaranteed to be reached during the structured phase, and the MRCA of B is then considered to be an allele of gene A, i.e., the mutation event that gave rise to B. After the structured phase, any remaining lineages are followed back to their MRCA according to the standard coalescent process. To the left of the recombination graph are the rates that gave rise to the chromosomes shown on the genealogy. The rates correspond to Equations 6–17.
F<sc>igure</sc> 4.—
Figure 4.—
Expected site-frequency spectra (SFS) for a recent gene duplication event. Expected SFS were estimated by 1000 simulated replicates for n = 10 and θ = 10 for a 1000-bp region. The SFS are normalized to be independent of θ. The duplicate gene fixed at time τ = 0. The mean gene conversion tract length is 100 bp. The SFS is shown separately for fixed differences between genes, for polymorphisms shared between genes, and for private polymorphisms unique to one gene. The effect of the rate of crossing over between loci (4Nr > 0) on the SFS is because crossing over will cause the two duplicated loci to have different histories, such that the most recent common ancestor of the ancestral gene does not occur at the same time as the origin of the duplicate gene (e.g., Figure 3).
F<sc>igure</sc> 5.—
Figure 5.—
Effect of mean conversion tract length on the site frequency spectrum (SFS). Expected SFS were estimated by 1000 simulated replicates for n = 10 and θ = 10 for a 1000-bp region. The duplicate gene fixed at time τ = 0. The recombination rate between loci is 4Nr = 10. The mean length of a gene conversion between loci, T varies. The SFS are normalized to be independent of θ.
F<sc>igure</sc> 6.—
Figure 6.—
Levels of variability (π) and Tajima's (1989) D as a function of the fixation time of a gene duplication event. The means of π and D are plotted as a function of the fixation time of the duplicate, for several combinations of the crossover and gene conversion rates between loci. Vertical lines extend to the upper and lower 2.5th quantiles of the simulated distributions. Results are based on 10,000 replicates for n = 50, θ = 10, and a mean tract length of 100 bp. The horizontal lines are the expectations of π (solid) and D (dashed) for the standard neutral model of a single-copy, nonrecombining locus.
F<sc>igure</sc> 7.—
Figure 7.—
Expected site frequency spectra (SFS) for copy-number variants. Expected SFS were estimated by 1000 simulated replicates for n = 10 and θ = 10 for a 1000-bp region, and the mean gene conversion tract length is 100 bp. The SFS are normalized to be independent of θ. The observed sample size of the polymporphic duplicate is n2. The rate of crossing over between loci is 4Nr = 10. The SFS is shown separately for fixed differences between gene duplicates, for polymorphisms shared between genes, and for private polymorphisms unique to one gene.
F<sc>igure</sc> 8.—
Figure 8.—
Levels of variability (π) and Tajima's (1989) D as a function of the number of occurrences of a copy-number variant. The means of π and D are indicated by circles, and vertical lines extend to the upper and lower 2.5th quantiles of the simulated distributions. Results are based on 10,000 replicates for n = 50, θ = 10, and a mean tract length of 100 bp. Here, n is the sample size of the ancestral gene, and the number of occurrences of the CNV is varied. The horizontal lines are the expectations of π (solid) and D (dashed) for the standard neutral model of a single-copy, nonrecombining locus.
F<sc>igure</sc> 9.—
Figure 9.—
Fay and Wu's H as a function of the frequency of a copy-number variant. The expectation of H was estimated from 1000 simulations of 50 chromosomes, with no gene conversion.

Similar articles

Cited by

References

    1. Andolfatto, P., 2005. Adaptive evolution of non-coding DNA in Drosophila. Nature 437: 1149–1152. - PubMed
    1. Arguello, J. R., Y. Chen, S. Yang, W. Wang and M. Long, 2006. Origination of an X-linked testes chimeric gene by illegitimate recombination in Drosophila. PLoS Genet. 2: e77. - PMC - PubMed
    1. Bailey, J. A., Z. Gu, R. A. Clark, K. Reinert, R. V. Samonte et al., 2002. Recent segmental duplications in the human genome. Science 297: 1003–1007. - PubMed
    1. Bailey, J. A., D. M. Church, M. Ventura, M. Rocchi and E. E. Eichler, 2004. Analysis of segmental duplications and genome assembly in the mouse. Genome Res. 14: 789–801. - PMC - PubMed
    1. Betran, E., and M. Long, 2003. Dntf-2r, a young Drosophila retroposed gene with specific male expression under positive Darwinian selection. Genetics 164: 977–988. - PMC - PubMed