. 2007 Oct;177(2):971-86.
doi: 10.1534/genetics.107.073791. Epub 2007 Aug 24.

Mutational interference and the progression of Muller's ratchet when mutations have a broad range of deleterious effects

Affiliations

Mutational interference and the progression of Muller's ratchet when mutations have a broad range of deleterious effects

R Jonas Söderberg et al. Genetics. 2007 Oct.

Abstract

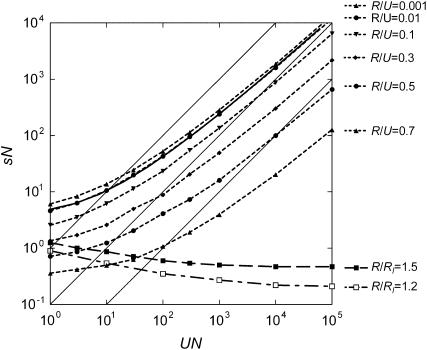
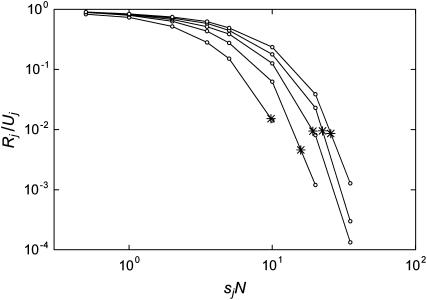
Deleterious mutations can accumulate in asexual haploid genomes through the process known as Muller's ratchet. This process has been described in the literature mostly for the case where all mutations are assumed to have the same effect on fitness. In the more realistic situation, deleterious mutations will affect fitness with a wide range of effects, from almost neutral to lethal. To elucidate the behavior of the ratchet in this more realistic case, simulations were carried out in a number of models, one where all mutations have the same effect on selection [one-dimensional (1D) model], one where the deleterious mutations can be divided into two groups with different selective effects [two-dimensional (2D) model], and finally one where the deleterious effects are distributed. The behavior of these models suggests that deleterious mutations can be classified into three different categories, such that the behavior of each can be described in a straightforward way. This makes it possible to predict the ratchet rate for an arbitrary distribution of fitness effects using the results for the well-studied 1D model with a single selection coefficient. The description was tested and shown to work well in simulations where selection coefficients are derived from an exponential distribution.


Figures

F<sc>igure</sc> 1.—
Figure 1.—
Normalized ratchet rate R/U vs. UN for different values of selection sN in the 1D model: dotted curves from top to bottom, sN = 0.1, 0.3, 1, 10, 32, 100, 316, and 103; solid curve, sN = 2.5. Straight lines are drawn between simulation points. The standard error in the data points is ≤1.5%, i.e., on the order of the size of the solid data points. Some points marked with open symbols were run with several different N-values: squares, N = 100, 316, 1000, and 3162; diamond, N = 100, 316, and 1000; triangles, N = 102, 103, and 104; circle, N = 102, 103, 104, and 105. The N-values used for the single data points are: N = 103 for UN < 3 × 10³, N = 104 for 3 × 10³ < UN < 3 × 10⁴, and N = 105 for UN > 3 × 10⁴.
F<sc>igure</sc> 2.—
Figure 2.—
The window of operation as a contour plot showing the values for UN and sN where (dotted curves from bottom to top) R/U = 0.7, 0.5, 0.3, 0.1, 0.01, and 0.001. The solid curve is UN = sN ln(sN/4), which almost exactly overlaps the dotted curve for R/U = 0.01. The dashed curve with solid squares is where R/RI = 1.5 and the dashed-dotted curve with open squares is where R/RI = 1.2. Straight lines have been drawn between simulation points. Thin solid lines show changes in N at constant s and U; from top to bottom, s/U = 1, 0.1, and 0.01. The N-values used varied as in Figure 1.
F<sc>igure</sc> 3.—
Figure 3.—
Scaled rate of fitness loss as a function of sN. The dotted curves are for (from left to right) UN = 1, 10, 100, 103, 104, and 105. The solid curve shows the same thing for independent fixations (Equation 1); this curve is independent of UN and corresponds to the rate in the limit UN ≪ 1. The dashed line is 0.22sN, which approximately follows the empirical maximum points determined by Equation 6. The asterisks show the points where the ratchet is assumed to be stalled according to Equation 5.
F<sc>igure</sc> 4.—
Figure 4.—
The ratchet speed for group 1 relative to what it would be by itself without interference, shown as a function of the selection in group 2. The three families shown have parameter values (from highest peak to lowest) (U1N, s1N, U2N) = (100, 10, 500), (100, 10, 100), and (0.5, 0.5, 10). Values of N varied between 100 and 70,000 for the 13–17 different curves in each family. Considering the different curves in each family as replicate runs, the maximum relative standard deviation in each family is ∼5%.
F<sc>igure</sc> 5.—
Figure 5.—
The window of interference and the location of maximum interference. Interference is possible in the region 1 < s2N < 2U2N. The data points are the locations of maximum interference estimated from curves like those in Figure 4. The solid line is the upper limit of interference (s2/U2 = 2) and the dashed line is the location of the points where group 2 would stop clicking if it were alone, Equation 5.
F<sc>igure</sc> 6.—
Figure 6.—
The scaled total rate of fitness loss in a system with two different kinds of mutations when selection in the second group (s2N) is changed (solid circles), calculated as formula image The solid squares show the ratchet considered as the sum of two independent 1D ratchets calculated as formula image The open symbols show the various approximations: the 1D ratchet with U = U1 + U2 and arithmetic mean s (open circles, dashed-dotted line); the 1D ratchet with U = U1 + U2 and harmonic mean s (open triangles, dotted line); the 1D ratchet with U = U1 + U2 and geometric mean s (open squares, dotted line); and the 1D ratchet with U = U1, s = s1, and effective population size formula image (open diamonds, dashed line). Parameter values used: U1N = 60, s1N = 5, U2N = 60. N = 103 is used in these calculations.
F<sc>igure</sc> 7.—
Figure 7.—
The clicking rate in 10 different groups of deleterious mutations normalized to the mutation rate in each group. The selection in each group is shown on the x-axis. The same Uj-value (Uj = U/10 for j = 1, 2,…, 10) was used in all groups and five different sets were run with (from top to bottom line) UN = 250, 200, 150, 100, and 50. Simulations in this case are based on the Moran model, and as described in the model section, this is implemented by running the simulations with the population size 2N for any given N-value; N = 500 is used here. The asterisks indicate the point below which the mutations are considered stalled according to Equation 8.
F<sc>igure</sc> 8.—
Figure 8.—
Predicted scaled rate of fitness loss for an exponential distribution of s-values. Results are shown as a function of formula image calculated from Equations 10–14; dotted lines are for UN = 103, 102, and 10 from top to bottom, and the lines were drawn between the calculated data points (crosses); solid data points are the simulated results from Table 2. The dashed line shows the expected result based on Equation 1 if all mutations accumulate independently and without background selection. The thin solid lines show the results for the 1D model with parameters N, U, and s = formula image using UN = 103, 102, and 10 from top to bottom.
F<sc>igure</sc> 9.—
Figure 9.—
Predicted scaled rate of fitness loss for an exponential distribution of s-values. Results are shown as a function of formula image calculated from Equations 10, 11, 13, and 14. Solid lines from top to bottom are for UNeb = 104, 103, 102, and 10. The dotted lines are from Equation 15 for UNeb = 104 and 10.

Similar articles

Cited by

References

    1. Andersson, D. I., and D. Hughes, 1996. Muller's ratchet decreases fitness of a DNA-based microbe. Proc. Natl. Acad. Sci. USA 93: 906–907. - PMC - PubMed
    1. Barton, N. H., and B. Charlesworth, 1998. Why sex and recombination? Science 281: 1986–1990. - PubMed
    1. Bergstrom, C. T., and J. Pritchard, 1998. Germline bottlenecks and the evolutionary maintenance of the mitochondrial genome. Genetics 149: 2135–2146. - PMC - PubMed
    1. Butcher, D., 1995. Muller's ratchet, epistasis and mutation effects. Genetics 141: 431–437. - PMC - PubMed
    1. Charlesworth, B., 1994. The effect of background selection against deleterious mutations on weakly selected, linked variants. Genet. Res. 63: 213–227. - PubMed

Publication types