Genomewide identification of genes under directional selection: gene transcription Q(ST) scan in diverging Atlantic salmon subpopulations
- PMID: 17720934
- PMCID: PMC2034609
- DOI: 10.1534/genetics.107.073759
Genomewide identification of genes under directional selection: gene transcription Q(ST) scan in diverging Atlantic salmon subpopulations
Abstract
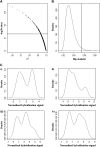
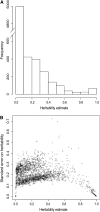
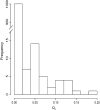
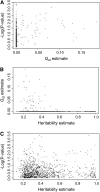
Evolutionary genomics has benefited from methods that allow identifying evolutionarily important genomic regions on a genomewide scale, including genome scans and QTL mapping. Recently, genomewide scanning by means of microarrays has permitted assessing gene transcription differences among species or populations. However, the identification of differentially transcribed genes does not in itself suffice to measure the role of selection in driving evolutionary changes in gene transcription. Here, we propose and apply a "transcriptome scan" approach to investigating the role of selection in shaping differential profiles of gene transcription among populations. We compared the genomewide transcription levels between two Atlantic salmon subpopulations that have been diverging for only six generations. Following assessment of normality and unimodality on a gene-per-gene basis, the additive genetic basis of gene transcription was estimated using the animal model. Gene transcription h(2) estimates were significant for 1044 (16%) of all detected cDNA clones. In an approach analogous to that of genome scans, we used the distribution of the Q(ST) values estimated from intra- and intersubpopulation additive genetic components of the transcription profiles to identify 16 outlier genes (average Q(ST) estimate = 0.11) whose transcription levels are likely to have evolved under the influence of directional selection within six generations only. Overall, this study contributes both empirically and methodologically to the quantitative genetic exploration of gene transcription data.
Figures


Similar articles
-
Genetic consequences of interbreeding between farmed and wild Atlantic salmon: insights from the transcriptome.Mol Ecol. 2008 Jan;17(1):314-24. doi: 10.1111/j.1365-294X.2007.03438.x. Mol Ecol. 2008. PMID: 18173503
-
Rapid parallel evolutionary changes of gene transcription profiles in farmed Atlantic salmon.Mol Ecol. 2006 Jan;15(1):9-20. doi: 10.1111/j.1365-294X.2005.02807.x. Mol Ecol. 2006. PMID: 16367826
-
Molecular and quantitative genetic divergence among populations of house mice with known evolutionary histories.Heredity (Edinb). 2005 May;94(5):518-25. doi: 10.1038/sj.hdy.6800652. Heredity (Edinb). 2005. PMID: 15741999
-
Fifteen years of genomewide scans for selection: trends, lessons and unaddressed genetic sources of complication.Mol Ecol. 2016 Jan;25(1):5-23. doi: 10.1111/mec.13339. Epub 2015 Sep 16. Mol Ecol. 2016. PMID: 26224644 Free PMC article. Review.
-
Genomic resources and their influence on the detection of the signal of positive selection in genome scans.Mol Ecol. 2016 Jan;25(1):170-84. doi: 10.1111/mec.13468. Epub 2015 Dec 17. Mol Ecol. 2016. PMID: 26562485 Review.
Cited by
-
Intrarater and interrater reliability of the Anteromedial Reach Test in healthy participants.Open Access J Sports Med. 2014 Feb 21;5:1-10. doi: 10.2147/OAJSM.S50149. eCollection 2014. Open Access J Sports Med. 2014. PMID: 24648776 Free PMC article.
-
Q(ST)-F(ST) comparisons: evolutionary and ecological insights from genomic heterogeneity.Nat Rev Genet. 2013 Mar;14(3):179-90. doi: 10.1038/nrg3395. Epub 2013 Feb 5. Nat Rev Genet. 2013. PMID: 23381120 Review.
-
Local adaptation contributes to gene expression divergence in maize.G3 (Bethesda). 2021 Feb 9;11(2):jkab004. doi: 10.1093/g3journal/jkab004. G3 (Bethesda). 2021. PMID: 33604670 Free PMC article.
-
Modularity Facilitates Flexible Tuning of Plastic and Evolutionary Gene Expression Responses during Early Divergence.Genome Biol Evol. 2018 Jan 1;10(1):77-93. doi: 10.1093/gbe/evx278. Genome Biol Evol. 2018. PMID: 29293993 Free PMC article.
-
Insights into the role of differential gene expression on the ecological adaptation of the snail Littorina saxatilis.BMC Evol Biol. 2010 Nov 18;10:356. doi: 10.1186/1471-2148-10-356. BMC Evol Biol. 2010. PMID: 21087461 Free PMC article.
References
-
- Aubin-Horth, N., J. F. Bourque, G. Daigle, R. Hedger and J. J. Dodson, 2006. Longitudinal gradients in threshold sizes for alternative male life history tactics in a population of Atlantic salmon (Salmo salar). Can. J. Fish. Aquat. Sci. 63: 2067–2075.
-
- Beaumont, M. A., 2005. Adaptation and speciation: What can F-st tell us? Trends Ecol. Evol. 20: 435–440. - PubMed
-
- Beaumont, M. A., and D. J. Balding, 2004. Identifying adaptive genetic divergence among populations from genome scans. Mol. Ecol. 13: 969–980. - PubMed
-
- Bochdanovits, Z., H. van der Klis and G. de Jong, 2003. Covariation of larval gene expression and adult body size in natural populations of Drosophila melanogaster. Mol. Biol. Evol. 20: 1760–1766. - PubMed
Publication types
MeSH terms
Substances
LinkOut - more resources
Full Text Sources

