. 2007 Oct 19;282(42):31085-93.
doi: 10.1074/jbc.M704085200. Epub 2007 Aug 25.

Nitro-fatty acid reaction with glutathione and cysteine. Kinetic analysis of thiol alkylation by a Michael addition reaction

Affiliations

Nitro-fatty acid reaction with glutathione and cysteine. Kinetic analysis of thiol alkylation by a Michael addition reaction

Laura M S Baker et al. J Biol Chem. .

Abstract

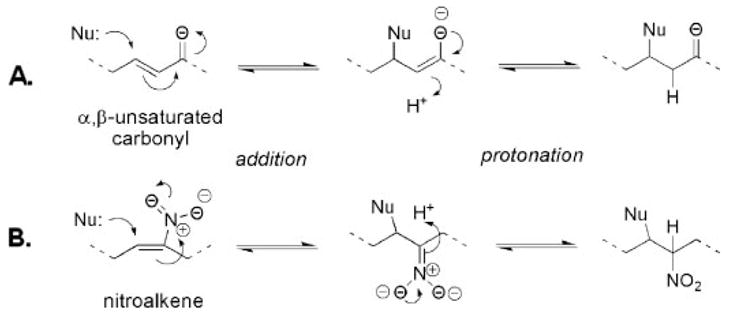
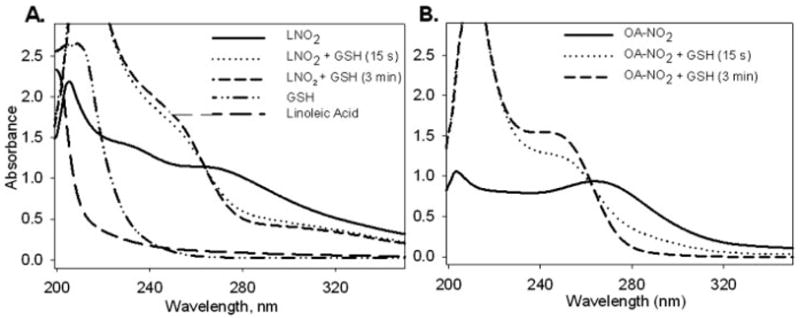
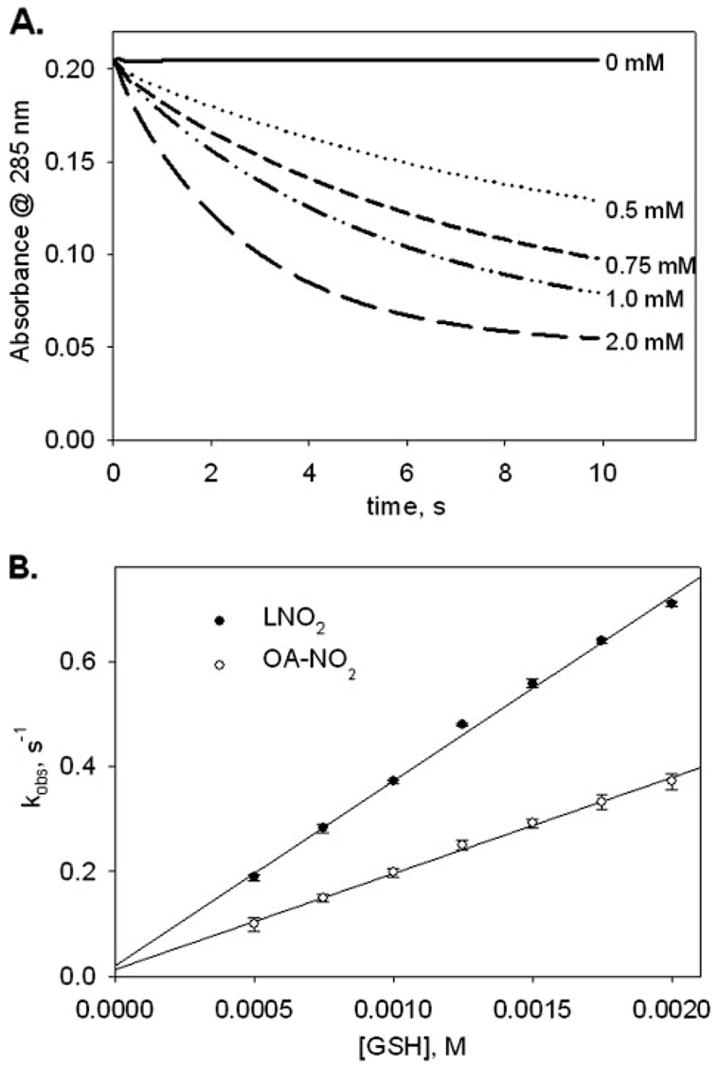
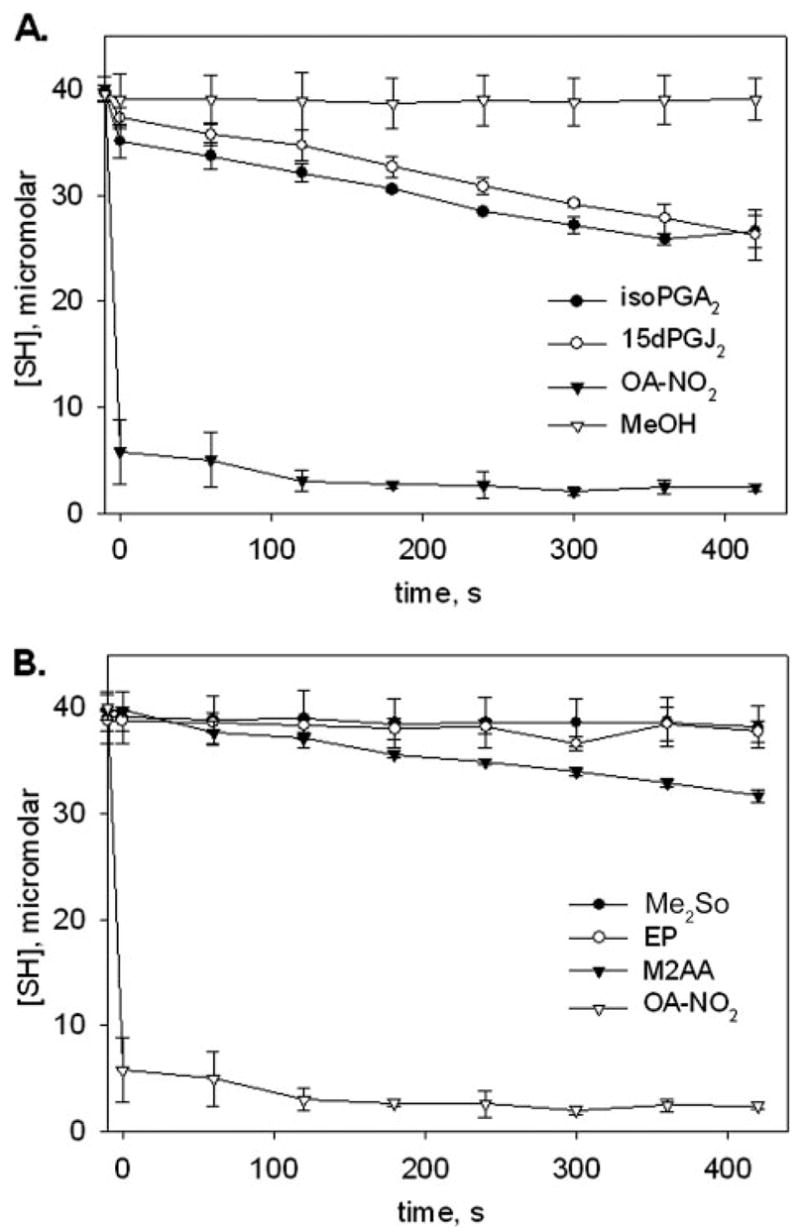
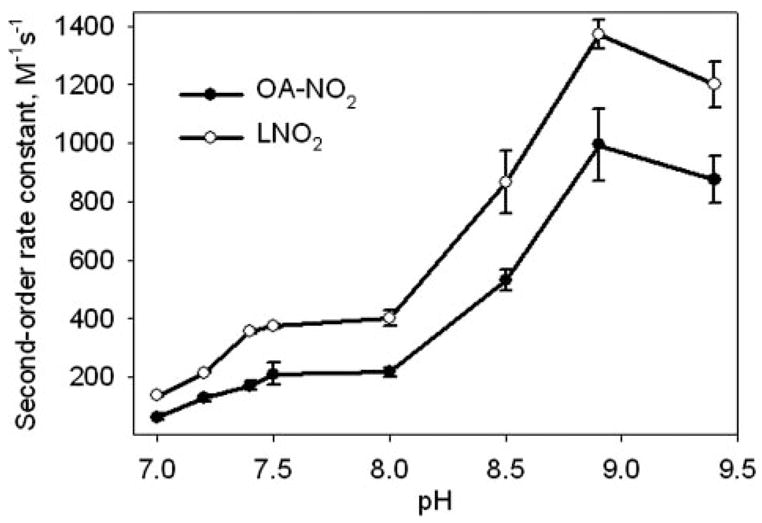
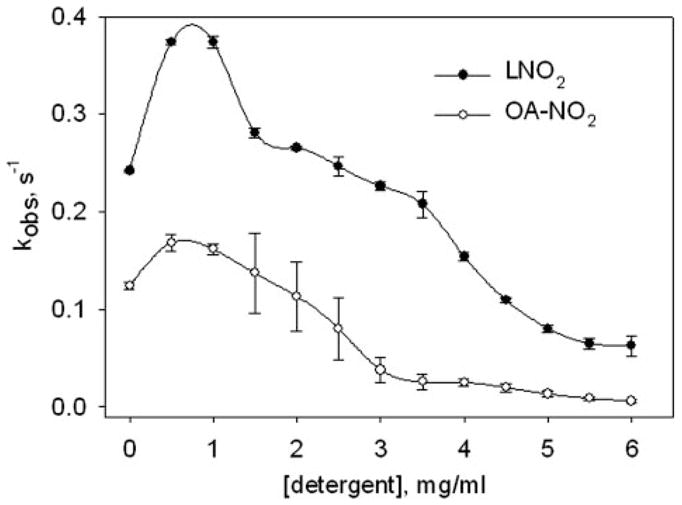
Fatty acid nitration by nitric oxide-derived species yields electrophilic products that adduct protein thiols, inducing changes in protein function and distribution. Nitro-fatty acid adducts of protein and reduced glutathione (GSH) are detected in healthy human blood. Kinetic and mass spectrometric analyses reveal that nitroalkene derivatives of oleic acid (OA-NO2) and linoleic acid (LNO2) rapidly react with GSH and Cys via Michael addition reaction. Rates of OA-NO2 and LNO2 reaction with GSH, determined via stopped flow spectrophotometry, displayed second-order rate constants of 183 M(-1)S(-1) and 355 M(-1)S(-1), respectively, at pH 7.4 and 37 degrees C. These reaction rates are significantly greater than those for GSH reaction with hydrogen peroxide and non-nitrated electrophilic fatty acids including 8-iso-prostaglandin A2 and 15-deoxy-Delta(12,14)-prostaglandin J2. Increasing reaction pH from 7.4 to 8.9 enhanced apparent second-order rate constants for the thiol reaction with OA-NO2 and LNO2, showing dependence on the thiolate anion of GSH for reactivity. Rates of nitroalkene reaction with thiols decreased as the pKa of target thiols increased. Increasing concentrations of the detergent octyl-beta-d-glucopyranoside decreased rates of nitroalkene reaction with GSH, indicating that the organization of nitro-fatty acids into micellar or membrane structures can limit Michael reactivity with more polar nucleophilic targets. In aggregate, these results reveal that the reversible adduction of thiols by nitro-fatty acids is a mechanism for reversible post-translational regulation of protein function by nitro-fatty acids.


Figures

FIGURE 1
FIGURE 1. Mechanism of Michael addition reaction
A, reaction of nucleophile (Nu) with an α,β-unsaturated carbonyl enone. The nucleophile reacts at the electrophilic β-position to form an adduct. B, reaction of nucleophile (such as thiolate) with a conjugated nitroalkene.
FIGURE 2
FIGURE 2. Spectral analysis of nitro-fatty acid reactions with GSH
Spectral scans of GSH (1 mM) and (A) LNO2 (100 μM) or (B) OA-NO2 (100 μM) were performed in 100 mM potassium phosphate, pH 7.4 using a diode array spectrophotometer between 200 – 400 nm. Free linoleic acid (100 μM) was also scanned separately for spectral comparisons with LNO2.
FIGURE 3
FIGURE 3. Kinetics of nitro-fatty acid reactions with GSH
A, rate of decrease in OA-NO2 absorbance at 285 nm was monitored on a stopped-flow spectrophotometer. Reactions were started by mixing increasing concentrations of GSH (0–2 mM) with OA-NO2 (0.02 mM), and nitroalkene absorbance decay was monitored at 285 nm. GSH concentration (mM) used for each reaction progression is noted at the end of each run. B, apparent pseudo-first-order rate constants (kobs) acquired from single exponential curve fits of the reaction progressions were plotted against [GSH]. The slope of the linear regression curve fit is equal to the apparent second-order rate constant, kapp. Data shown are for experiments with LNO2 (solid circles) and OA-NO2 (unfilled circles) and are expressed as mean ± S.D. from three or more separate experiments. The standard deviation bar is not discernible from individual data points in all cases.
FIGURE 4
FIGURE 4. Comparison of reaction rates for prostaglandins and nitro-fatty acids
A, an excess concentration (1.3 mM) of OA-NO2 (filled squares), 8-iso-PGA2 (filled circles), or 15-deoxy-Δ12,14-PGJ2 (unfilled triangles) was reacted against GSH (0.388 mM) at pH 7.4, 37 °C. Aliquots (100 μl) were removed over time, reactions were stopped with 5× DTNB and then diluted with 50 mM Tris, pH 8.0 prior to thiol quantification at 412 nm. MeOH (40 μl, unfilled diamonds) was added to one reaction as a control, and GSH thiol content was assessed as above. Unaltered A412 readings were plotted against time to give a visual representation of reaction rates. Data are expressed as mean ± S.D. for three separate experiments. Calculated apparent second-order rate constants for the prostaglandins appear in Table 2. B, above experiment was repeated with the electrophiles ethyl pyruvate (EP, unfilled circles) and methyl-2-acetamidoacrylate (M2AA, filled triangles), and compared with the vehicle control (DMSO, filled circles) and OA-NO2 (unfilled triangles).
FIGURE 5
FIGURE 5. Effect of pH on nitro-fatty acid reaction rates
Reactions of GSH (0 –2 mM) and OA-NO2 (0.02 mM, solid circles) or LNO2 (0.02 mM, unfilled circles) were followed by monitoring the decay of nitroalkene absorbance at 285 nm over a range of pH values, as described under “Experimental Procedures.” For the pH range 7.0 –7.5, 100 mM potassium phosphate buffers were used, and for the pH range 8.0 –9.4, 100 mM Tris buffers were used. Second-order rate constants were plotted for a range of pH values. Data are expressed as mean ± S.D. from three or more separate experiments.
FIGURE 6
FIGURE 6. Kinetic analysis of micellar inhibition of nitro-fatty acid reactions with GSH
OA-NO2 (unfilled circles, 0.02 mM) or LNO2 (filled circles, 0.02 mM) were reacted with GSH (1 mM) on the stopped flow spectrophotometer as described under “Experimental Procedures,” except the reaction buffer contained 0 – 6 mg/ml of octyl-β-D-glucopyranoside. The obtained pseudo-first-order reaction rate was plotted against detergent concentration. Data are expressed as mean ± S.D. from three or more separate experiments.

References

    1. Marnett LJ, Riggins JN, West JD. J Clin Investig. 2003;111:583–593. - PMC - PubMed
    1. Lee SH, Williams MV, Dubois RN, Blair IA. J Biol Chem. 2005;280:28337–28346. - PubMed
    1. Sayre LM, Lin D, Yuan Q, Zhu X, Tang X. Drug Metab Rev. 2006;38:651–675. - PubMed
    1. Straus DS, Glass CK. Med Res Rev. 2001;21:185–210. - PubMed
    1. Talalay P, De Long MJ, Prochaska HJ. Proc Natl Acad Sci U S A. 1988;85:8261–8265. - PMC - PubMed

Publication types