Comparative Study
. 2008 Mar;57(3):289-302.
doi: 10.1007/s00262-007-0378-0. Epub 2007 Aug 25.

The CIMT-monitoring panel: a two-step approach to harmonize the enumeration of antigen-specific CD8+ T lymphocytes by structural and functional assays

Affiliations
Comparative Study

The CIMT-monitoring panel: a two-step approach to harmonize the enumeration of antigen-specific CD8+ T lymphocytes by structural and functional assays

C M Britten et al. Cancer Immunol Immunother. 2008 Mar.

Abstract

The interpretation of the results obtained from immunomonitoring of clinical trials is a difficult task due to the variety of methods and protocols available to detect vaccine-specific T-cell responses. This heterogeneity as well as the lack of standards has led to significant scepticism towards published results. In February 2005, a working group was therefore founded under the aegis of the Association for Immunotherapy of Cancer ("CIMT") in order to compare techniques and protocols applied for the enumeration of antigen-specific T-cell responses. Here we present the results from two consecutive phases of an international inter-laboratory testing project referred to as the "CIMT monitoring panel". A total of 13 centers from six European countries participated in the study in which pre-tested PBMC samples, synthetic peptides and PE-conjugated HLA-tetramers were prepared centrally and distributed to participants. All were asked to determine the number of antigen-specific T-cells in each sample using tetramer staining and one functional assay. The results of the first testing round revealed that the total number of cells analyzed was the most important determinant for the sensitive detection of antigen-specific CD8(+) T-cells by tetramer staining. Analysis by ELISPOT was influenced by a combination of cell number and a resting phase after thawing of peripheral blood mononuclear cells. Therefore, the experiments were repeated in a second phase but now the participants were asked to change their protocols according to the new guidelines distilled from the results of the first phase. The recommendations improved the number of antigen-specific T-cell responses that were detected and decreased the variability between the laboratories. We conclude that a two-step approach in inter-laboratory testing allows the identification of distinct variables that influence the sensitivity of different T-cell assays and to formally show that a defined correction to the protocols successfully increases the sensitivity and reduces the inter-center variability. Such "two-step" inter-laboratory projects could define rational bases for accepted international guidelines and thereby lead to the harmonization of the techniques used for immune monitoring.


Figures

Fig. 1
Fig. 1
Example of tetramer staining results as provided by four selected participating centers Z5, Z12, Z8 and Z1. All stainings were performed on donor D1 from phase I/2005 who showed reactivity with both of the tested tetramers. Cells were gated either on the lymphocyte population (Z1), or the subsets of CD3+CD8+ (Z5) or CD3+ (Z8, Z12), according to the Ab combination used by each lab. The upper panel shows results for tests with the CMV-tetramer, the lower panel shows results for tests with the influenza-tetramer. In all dot-plots, the tetramer staining is displayed on the y-axis and anti-CD8-staining on the x-axis. Number of counted CD8+ T-cells and percentage of tetramer-positive cells among the CD8 subset are indicated
Fig. 2
Fig. 2
a Subgroup analysis of tetramer results from phase I/2005. Bars indicate the percentage of positives that could be detected by tetramer staining. The first group of bars shows the results for all of the six detectable positives, the second group shows results from stainings with the CMV-tetramer and the third group of columns shows results from stainings with the influenza-tetramer. The open bars in each group represent all tests performed, grey bars represent results obtained in tests that were performed on more than 3 × 104 CD8+ T-cells and black bars represent results obtained in tests that were performed on less than 3 × 104 CD8+ T-cells. The boxes within each bar indicate the fraction of tests with a positive result. The asterisk indicates a P-value < 0.05 by Chi-square analysis. b Subgroup analysis of ELISPOT results from phase I/2005. The bars indicate the percentage of positive reactivities detected by IFNγ ELISPOT assays. The open bar shows the percentage of all reactivities detected by all 11 centers that performed the ELISPOT assay as the functional test. Criteria for division of centers into two subgroups were based on the following requirements: do not use allo-APC (first subgroup analysis), use a resting time (second subgroup analysis) or use equal or more than 400,000 PBMC per well (third subgroup analysis). Grey bars always represent centers that were in conformity with the indicated minimum requirement, black bars show results from centers that did not fulfil that requirement. The boxes within each column indicate the fraction of centers in each category. The asterisks indicate a P-value < 0.05 in Chi-square analysis
Fig. 3
Fig. 3
Distribution of antigen-specific T-cell frequencies in the two testing phases as obtained by tetramer staining (a) and IFNγ ELISPOT assays (b). The figure shows the six reactivities (filled circle) and the calculated mean of all reactivities from phase I/2005 (filled line) as well as the eight reactivities (open circle) and calculated mean of all reactivities from phase II/2006 (open line). The frequency of antigen-specific T-cells is indicated on the y-axis as 1 per x counted CD8+ T-cells for the tetramer test and as 1 per x seeded PBMC for the ELISPOT assay
Fig. 4
Fig. 4
Probability of detecting a reactivity by a tetramer staining, or b IFNγ ELISPOT assay. A trendline was inserted on the basis of results from all 14 reactivities from both phases of the panel. The figure shows the six reactivities from phase I/2005 (filled squares) and the eight reactivities from phase II/2006 (open squares). The frequency of antigen-specific T-cells is shown on the x-axis in 1 per x counted CD8+ T-cells for the tetramer assay (a) or 1 per x seeded PBMC for the ELISPOT assay (b). X-values for y = 90% and y = 50% are indicated by the broken lines
Fig. 5
Fig. 5
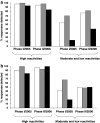
a Percentage of reactivities actually detected by tetramer staining. The first two groups of bars show the detection rate for the nine high reactivities (>1 per 1,200 CD8+ T-cells) in phase I/2005 and phase II/2006. The next two groups of bars show the detection rate for five moderate to low reactivities (<1 per 1,200 CD8+) in phase I/2005 (third group) or phase II/2006 (fourth group). The open bars represent all tests performed, grey bars represent results obtained in tests that were performed on more than 3 × 104 CD8+ T-cells and filled bars represent results obtained in tests that were performed on less than 3 × 104 CD8+ T-cells. b Percentage of reactivities detected in IFNγ ELISPOT assays. The first two groups of bars show the rate of detection of the four high reactivities (>1 per 2,850 PBMC in phase I/2005 and phase II/2006. The next two groups of columns show the rate of detection for the ten moderate to low reactivities (<1 per 2,850 PBMC) in phase I/2005 and phase II/2006. The open bars represent the performances of all centers in the respective panel phase, grey bars represent results obtained from the five centers that already fulfilled at least three of the four minimum criteria in phase I/2005 and filled bars represent results obtained from centers that fulfilled less than three of the four minimum criteria in phase I/2005

Comment in

Comment on

References

    1. Mocellin S, Lise M, Nitti D. Targeted therapy for colorectal cancer: mapping the way. Trends Mol Med. 2005;11:327. doi: 10.1016/j.molmed.2005.05.002. - DOI - PubMed
    1. Mocellin S, Mandruzzato S, Bronte V, Marincola FM. Cancer vaccines: pessimism in check. Nat Med. 2004;10:1278. doi: 10.1038/nm1204-1278. - DOI - PubMed
    1. Restifo NP, Rosenberg SA. Use of standard criteria for assessment of cancer vaccines. Lancet Oncol. 2005;6:3. - PMC - PubMed
    1. Galon J, Costes A, Sanchez-Cabo F, Kirilovsky A, Mlecnik B, Lagorce-Pages C, Tosolini M, Camus M, Berger A, Wind P, Zinzindohoue F, Bruneval P, Cugnenc PH, Trajanoski Z, Fridman WH, Pages F. Type, density, and location of immune cells within human colorectal tumors predict clinical outcome. Science. 2006;313:1960. doi: 10.1126/science.1129139. - DOI - PubMed
    1. Romero P, Cerottini JC, Speiser DE. Monitoring tumor antigen specific T-cell responses in cancer patients and phase I clinical trials of peptide-based vaccination. Cancer Immunol Immunother. 2004;53:249. doi: 10.1007/s00262-003-0473-9. - DOI - PMC - PubMed

MeSH terms