. 2007 Aug;3(8):e162.
doi: 10.1371/journal.pcbi.0030162. Epub 2007 Jul 3.

Inferring function using patterns of native disorder in proteins

Affiliations

Inferring function using patterns of native disorder in proteins

Anna Lobley et al. PLoS Comput Biol. 2007 Aug.

Abstract

Natively unstructured regions are a common feature of eukaryotic proteomes. Between 30% and 60% of proteins are predicted to contain long stretches of disordered residues, and not only have many of these regions been confirmed experimentally, but they have also been found to be essential for protein function. In this study, we directly address the potential contribution of protein disorder in predicting protein function using standard Gene Ontology (GO) categories. Initially we analyse the occurrence of protein disorder in the human proteome and report ontology categories that are enriched in disordered proteins. Pattern analysis of the distributions of disordered regions in human sequences demonstrated that the functions of intrinsically disordered proteins are both length- and position-dependent. These dependencies were then encoded in feature vectors to quantify the contribution of disorder in human protein function prediction using Support Vector Machine classifiers. The prediction accuracies of 26 GO categories relating to signalling and molecular recognition are improved using the disorder features. The most significant improvements were observed for kinase, phosphorylation, growth factor, and helicase categories. Furthermore, we provide predicted GO term assignments using these classifiers for a set of unannotated and orphan human proteins. In this study, the importance of capturing protein disorder information and its value in function prediction is demonstrated. The GO category classifiers generated can be used to provide more reliable predictions and further insights into the behaviour of orphan and unannotated proteins.


Conflict of interest statement

Competing interests. The authors have declared that no competing interests exist.

Figures

Figure 1
Figure 1. Molecular Function (A) and Biological Process (B) Categories That Are Enriched in Disordered Proteins
Category names have been abbreviated: regulation (reg), transcription (t), biosynthesis (b), organisation (o), phosphorous (phos), and amino acid (aa). All reported categories are enriched in disordered proteins with p-value < 0.001. The x-axis represents the log odds ratios of observed/expected frequencies of disordered proteins in each GO category from the Fisher test. Higher odds ratios indicate greater enrichment of disordered proteins than expected by chance for the GO category.
Figure 2
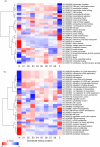
Figure 2. Location Features Encoding Protein Disorder for Molecular Function (A) Categories and Biological Process (B) Categories That Are Enriched in Disordered Proteins
The locations are represented on the x-axis from N terminus through equally proportioned mid segments S1–S8 to C terminus. The clustering of GO categories was performed using Ward's hierarchical clustering method [30]. The heatmap colours reflect the significance of the association between the frequency of disordered residues within the location region and the GO category. Red blocks indicate that a high average frequency of disordered residues is associated with the GO category and the location region. Blue blocks indicate an association between low average frequency of disordered residues in the location and GO category.
Figure 3
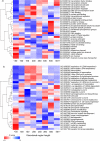
Figure 3. Length Dependence of Disordered Protein Functions for Molecular (A) Function Categories and Biological Process (B) Categories Enriched in Disordered Proteins
The x-axis ranges represent ranges of disordered residue lengths; 1–50, 51–100, 101–150, 151–200, 201–250, 251–300, 301–500, and 501+. The clustering was performed using Ward's hierarchical clustering method [30]. The heatmap colours reflect the significance of the association between the frequency of disordered regions within a length range and the GO category. Red blocks indicate a significant association between high average frequency of disordered regions and GO category, and blue blocks indicate a significant association between low average frequency of disordered regions and GO category.
Figure 4
Figure 4. Multidimensional Scaling Plot of Feature Space Represented in Three Dimensions
Feature descriptors that are closely correlated across all proteins are close together in feature space. The scale units of the plot are arbitrary and relative to the smallest correlation between feature pairs (1.27e-05) as measured by the Pearson correlation coefficient.
Figure 5
Figure 5. Relative Feature Importance
Bar height represents median average percent loss in classifier performance for each feature group. Feature groups are abbreviated to aa (amino acid), coils (coiled coils), diso (disorder), lowc (low complexity), nglyc (n-glycosylation), oglyc (o-glycosylation), pest (PEST regions), phos (phosphorylation), psort (protein sorting), seq_feat (sequence features), sigp (signal peptide), ss (secondary structure), and tm (transmembrane regions).
Figure 6
Figure 6. Receiver Operating Characteristics for Molecular Function (A) and Biological Process (B) Classifiers
The ROC curve can be used to judge the classification sensitivities represent by the x-axis at different false positive rates represented on the y-axis.
Figure 7
Figure 7. Benchmark Comparison Results
Classification accuracy was assessed using Matthews correlation (y-axis) for eighty common GO categories for our method and for the ProtFun server. Results for our method without disorder features were shown to emphasize that performance improvements could also be the result of the use of more up-to-date training example data, feature-encoding strategies, and different machine learning algorithms.

Similar articles

Cited by

References

    1. Rost B, Liu J, Nair R, Wrzeszczynski KO, Ofran Y. Automatic prediction of protein function. Cell Mol Life Sci. 2003;60:2637–2650. - PMC - PubMed
    1. Friedberg I. Automated protein function prediction—The genomic challenge. Brief Bioinform. 2006;7:225–242. - PubMed
    1. Ofran Y, Punta M, Schneider R, Rost B. Beyond annotation transfer by homology novel protein-function prediction methods to assist drug discovery. Drug Discov Today. 2005;10:1475–1482. - PubMed
    1. Jensen LJ, Gupta R, Staerfeldt HH, Brunak S. Prediction of human protein function according to Gene Ontology categories. Bioinformatics. 2003;19:635–642. - PubMed
    1. Jensen LJ, Gupta R, Blom N, Devos D, Tamames J, et al. Prediction of human protein function from post-translational modifications and localization features. J Mol Biol. 2002;319:1257–1265. - PubMed

Publication types