

Natural killer cells promote early CD8 T cell responses against cytomegalovirus
- PMID: 17722980
- PMCID: PMC1950948
- DOI: 10.1371/journal.ppat.0030123
Natural killer cells promote early CD8 T cell responses against cytomegalovirus
Abstract
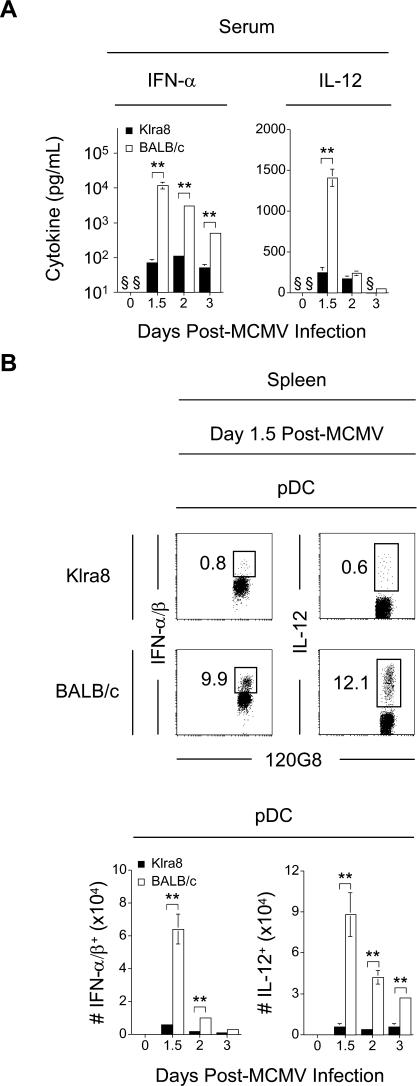
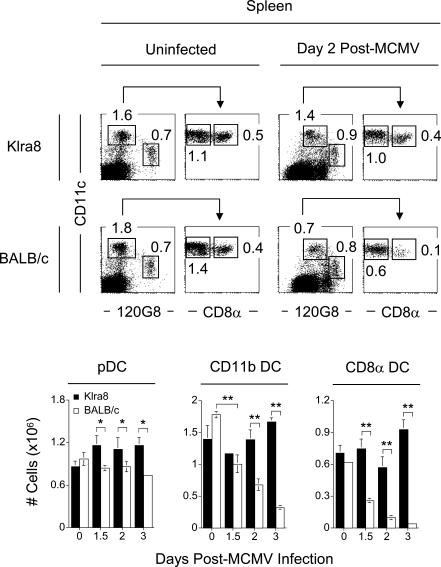
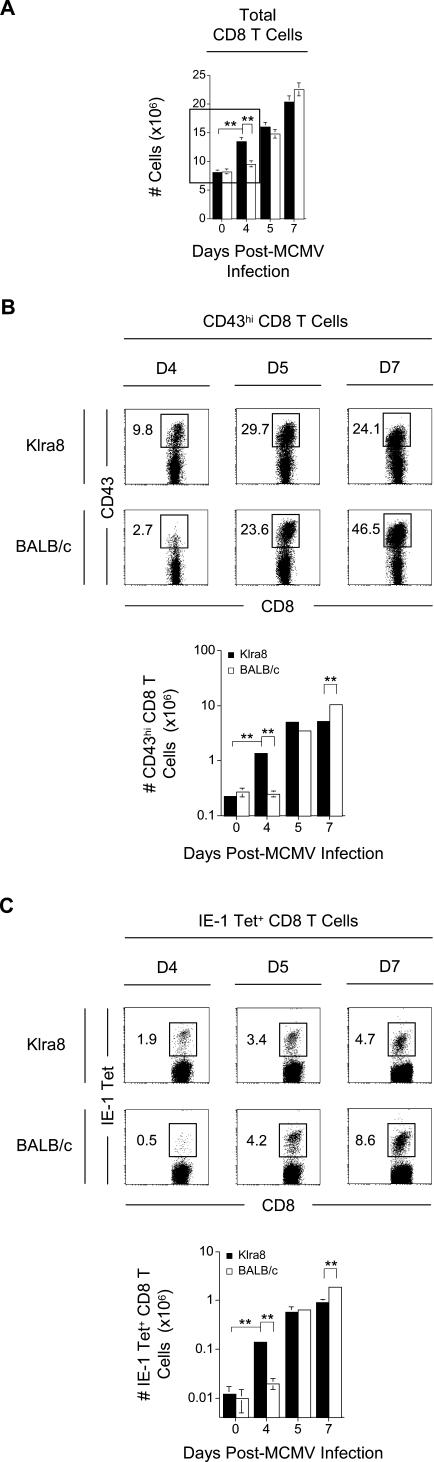
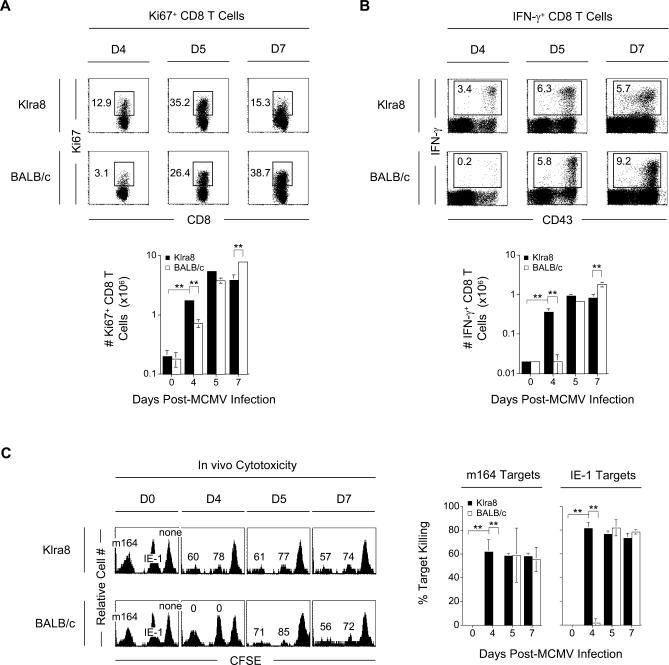
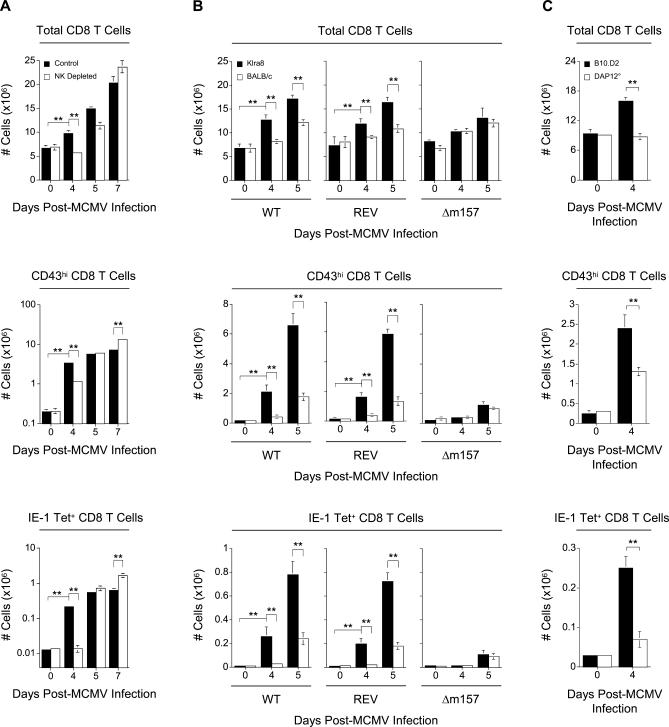
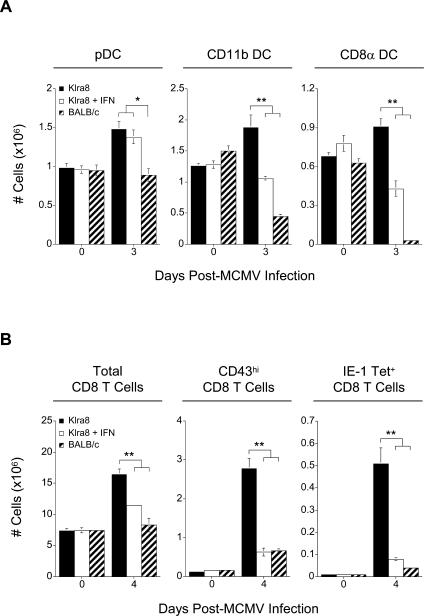
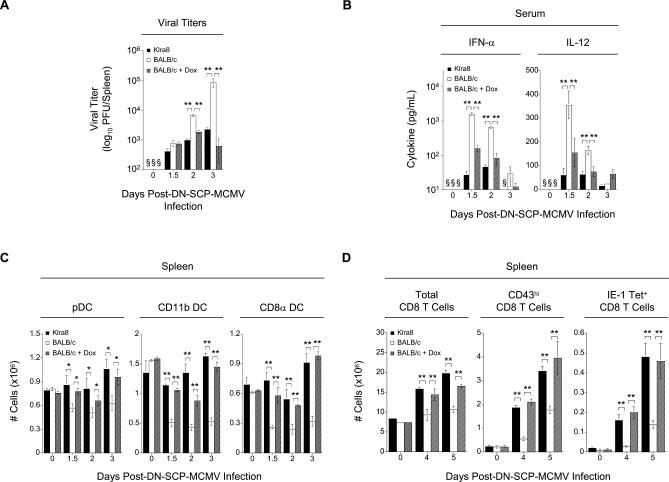
Understanding the mechanisms that help promote protective immune responses to pathogens is a major challenge in biomedical research and an important goal for the design of innovative therapeutic or vaccination strategies. While natural killer (NK) cells can directly contribute to the control of viral replication, whether, and how, they may help orchestrate global antiviral defense is largely unknown. To address this question, we took advantage of the well-defined molecular interactions involved in the recognition of mouse cytomegalovirus (MCMV) by NK cells. By using congenic or mutant mice and wild-type versus genetically engineered viruses, we examined the consequences on antiviral CD8 T cell responses of specific defects in the ability of the NK cells to control MCMV. This system allowed us to demonstrate, to our knowledge for the first time, that NK cells accelerate CD8 T cell responses against a viral infection in vivo. Moreover, we identify the underlying mechanism as the ability of NK cells to limit IFN-alpha/beta production to levels not immunosuppressive to the host. This is achieved through the early control of cytomegalovirus, which dramatically reduces the activation of plasmacytoid dendritic cells (pDCs) for cytokine production, preserves the conventional dendritic cell (cDC) compartment, and accelerates antiviral CD8 T cell responses. Conversely, exogenous IFN-alpha administration in resistant animals ablates cDCs and delays CD8 T cell activation in the face of NK cell control of viral replication. Collectively, our data demonstrate that the ability of NK cells to respond very early to cytomegalovirus infection critically contributes to balance the intensity of other innate immune responses, which dampens early immunopathology and promotes optimal initiation of antiviral CD8 T cell responses. Thus, the extent to which NK cell responses benefit the host goes beyond their direct antiviral effects and extends to the prevention of innate cytokine shock and to the promotion of adaptive immunity.
Conflict of interest statement
Figures
Similar articles
-
The IFN regulatory factor 7-dependent type I IFN response is not essential for early resistance against murine cytomegalovirus infection.Eur J Immunol. 2009 Apr;39(4):1007-18. doi: 10.1002/eji.200838814. Eur J Immunol. 2009. PMID: 19283778
-
Natural Killer Cell Sensing of Infected Cells Compensates for MyD88 Deficiency but Not IFN-I Activity in Resistance to Mouse Cytomegalovirus.PLoS Pathog. 2015 May 8;11(5):e1004897. doi: 10.1371/journal.ppat.1004897. eCollection 2015 May. PLoS Pathog. 2015. PMID: 25954804 Free PMC article.
-
Interaction between conventional dendritic cells and natural killer cells is integral to the activation of effective antiviral immunity.Nat Immunol. 2005 Oct;6(10):1011-9. doi: 10.1038/ni1244. Epub 2005 Sep 4. Nat Immunol. 2005. PMID: 16142239
-
Dendritic cells in cytomegalovirus infection: viral evasion and host countermeasures.APMIS. 2009 May;117(5-6):413-26. doi: 10.1111/j.1600-0463.2009.02449.x. APMIS. 2009. PMID: 19400865 Review.
-
Role of early cytokines, including alpha and beta interferons (IFN-alpha/beta), in innate and adaptive immune responses to viral infections.Semin Immunol. 1998 Oct;10(5):383-90. doi: 10.1006/smim.1998.0138. Semin Immunol. 1998. PMID: 9799713 Review.
Cited by
-
High-Affinity Superantigen-Based Trifunctional Immune Cell Engager Synergizes NK and T Cell Activation for Tumor Suppression.Adv Sci (Weinh). 2024 Sep;11(33):e2310204. doi: 10.1002/advs.202310204. Epub 2024 Jun 27. Adv Sci (Weinh). 2024. PMID: 38937984 Free PMC article.
-
Lifting the innate immune barriers to antitumor immunity.J Immunother Cancer. 2020 Apr;8(1):e000695. doi: 10.1136/jitc-2020-000695. J Immunother Cancer. 2020. PMID: 32273348 Free PMC article. Review.
-
Self MHC class I-licensed NK cells enhance adaptive CD8 T-cell viral immunity.Blood. 2011 May 12;117(19):5133-41. doi: 10.1182/blood-2010-12-324632. Epub 2011 Mar 23. Blood. 2011. PMID: 21436069 Free PMC article.
-
A chemokine-like viral protein enhances alpha interferon production by plasmacytoid dendritic cells but delays CD8+ T cell activation and impairs viral clearance.J Virol. 2013 Jul;87(14):7911-20. doi: 10.1128/JVI.00187-13. Epub 2013 May 8. J Virol. 2013. PMID: 23658453 Free PMC article.
-
High IFN-gamma and TNF production by peripheral NK cells of Colombian patients with different clinical presentation of Plasmodium falciparum.Malar J. 2012 Feb 8;11:38. doi: 10.1186/1475-2875-11-38. Malar J. 2012. PMID: 22316273 Free PMC article.
References
-
- Krmpotic A, Bubic I, Polic B, Lucin P, Jonjic S. Pathogenesis of murine cytomegalovirus infection. Microbes Infect. 2003;5:1263–1277. - PubMed
-
- French AR, Yokoyama WM. Natural killer cells and viral infections. Curr Opin Immunol. 2003;15:45–51. - PubMed
-
- Zitvogel L, Terme M, Borg C, Trinchieri G. Dendritic cell-NK cell cross-talk: Regulation and physiopathology. Curr Top Microbiol Immunol. 2006;298:157–174. - PubMed
-
- Yewdell JW, Haeryfar SM. Understanding presentation of viral antigens to CD8+ T cells in vivo: The key to rational vaccine design. Annu Rev Immunol. 2005;23:651–682. - PubMed
-
- Hangartner L, Zinkernagel RM, Hengartner H. Antiviral antibody responses: The two extremes of a wide spectrum. Nat Rev Immunol. 2006;6:231–243. - PubMed
Publication types
MeSH terms
Substances
LinkOut - more resources
Full Text Sources
Other Literature Sources
Molecular Biology Databases
Research Materials
