. 2007 Aug 24;3(8):e124.
doi: 10.1371/journal.ppat.0030124.

Role of dendritic cells in differential susceptibility to viral demyelinating disease

Affiliations

Role of dendritic cells in differential susceptibility to viral demyelinating disease

Wanqiu Hou et al. PLoS Pathog. .

Abstract

Although persistent viral diseases are a global health concern, the mechanisms of differential susceptibility to such infections among individuals are unknown. Here, we report that differential interactions between dendritic cells (DCs) and virus are critical in determining resistance versus susceptibility in the Theiler murine encephalomyelitis virus-induced demyelinating disease model of multiple sclerosis. This virus induces a chronic demyelinating disease in susceptible mice, whereas the virus is completely cleared in resistant strains of mice. DCs from susceptible mice are more permissive to viral infection, resulting in severe deficiencies in development, expansion, and function, in contrast to DCs from resistant mice. Although protective prior to viral infection, higher levels of type I interferons (IFNs) and IFN-gamma produced by virus-infected DCs from susceptible mice further contribute to the differential inhibition of DC development and function. An increased DC number and/or acquired resistance of DCs to viral infection render susceptible mice resistant to viral persistence and disease progression. Thus, the differential permissiveness of DCs to infectious agents and its subsequent functional and developmental deficiencies determine the outcome of infection- associated diseases. Therefore, arming DCs against viral infection-induced functional decline may provide a useful intervention for chronic infection-associated diseases.


Conflict of interest statement

Competing interests. The authors have declared that no competing interests exist.

Figures

Figure 1
Figure 1. Elevated Viral Replication and Reduced Maturation of SJL DCs following TMEV Infection
(A) For the virus binding assay, DCs obtained from a 5-d culture of primary BM cells were incubated with UV-inactivated TMEV or TMEV (MOI 10) for 1 h at 4 °C, fixed with 1% PFA, and stained with anti-TMEV monoclonal antibody (open histogram) or isotype antibody (filled histogram) followed by FITC-conjugated secondary antibody. (B) To determine viral infection and replication levels, DCs were infected at MOI 10 for 1, 6, 12, 24, and 48 h. Expression of TMEV proteins in DCs was detected using anti-TMEV mAb and anti-CD11c antibody. Virus production was assessed by plaque assay. (C) The fraction of virus protein-positive cells was determined at different stages of culture of BMCs. (D) DCs were infected for 24 h and then analyzed for levels of maturation-associated markers (MHC-II, CD86, and CCR7, y-axis) and TMEV protein (x-axis) by intracellular staining with gated CD11c+ cells.
Figure 2
Figure 2. Cytokines Produced by Infected DCs and Their Effects on DC Activation
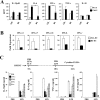
(A) SJL and B6 DCs of a 5-d culture of BMCs were infected with TMEV for 24 h and concentrations of cytokines secreted were determined by ELISA. Statistically significant differences from the values in mock-infected DCs are indicated with asterisks (*, p < 0.05; **, p < 0.01; ***, p < 0.001). (B) SJL and B6 DCs were infected with TMEV for 8 h. Total RNAs from DCs were prepared for quantitative real-time PCR analysis. Data are expressed by fold increases as compared to mock-infected cells. Results are shown as mean plus SD. (C) SJL DCs were treated with IFN-α (1,000 U/ml), IFN-β (1,000 U/ml), IFN-γ (10 ng/ml), IL-6 (100 ng/ml), or left untreated for 24 h. LPS was added for the final 6 h of culture. Cytokine levels in supernatants were determined with ELISA. Statistical differences between the values of untreated and treated DCs are indicated with asterisks (*, p < 0.05; **, p < 0.01).
Figure 3
Figure 3. Inhibition of Viral Infection in DCs Pretreated with LPS or IFNs
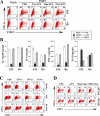
(A) LPS was added 6 h before infection (pre-LPS), simultaneously (sim-LPS), or 18 h after infection (post-LPS). DCs were infected with virus for 24 h and then scored by staining for intracellular viral proteins. (B) DCs were cultured with or without LPS for 6 h, washed twice, and then infected by TMEV for 24 h. After 18 h infection, LPS was added for the final 6 h of culture. Cytokine production was determined with specific ELISA. The differences between the values of mock-infected and TMEV-infected DCs are highly significant (***, p < 0.001). (C) IFN-α (100 U/ml), IFN-β (100 U/ml), or IFN-γ (1 ng/ml) was added to SJL DCs 6 h before infection (pre-6 h), simultaneously (sim) with infection, or 6 h after infection (post-6 h). All groups of DCs were infected with TMEV for 24 h. Expression of TMEV proteins in DCs was detected using anti-TMEV mAb and anti-CD11c antibody. (D) Mock- or TMEV-infected SJL DC supernatants were collected after 24 h of infection, and live virus in the supernatants was inactivated with UV. Cell-free supernatants (400 μl/ml) were added to freshly prepared IFN-α/βR-sufficient and -deficient DCs and incubated for 6 h, prior to infection with TMEV for 24 h. Parallel DC cultures were pretreated with LPS or PBS for 6 h. The ability of the fresh DCs to produce viral antigens was detected using anti-TMEV mAb and anti-CD11c antibody.
Figure 4
Figure 4. Inhibition of DC Expansion following TMEV Infection via Apoptosis and Growth Arrest
(A) BMCs were cultured with GM-CSF for 3 d and then mock-infected or infected with TMEV. Phase contrast micrographs (×100) of BMCs were taken at 3 dpi. (B) BMC cell numbers were determined at day 0 and 2, 3, and 4 dpi. (C) Cells obtained from 3-d BM cultures were infected with TMEV (MOI 10) for 24 h and then labeled with Annexin V. The Annexin V–positive and –negative cells were isolated using an Annexin V MicroBead kit. Cells were then fixed, permeabilized, and stained with anti-TMEV mAb and anti-CD11c antibody. (D) BMCs cultured with GM-CSF for 3 d were stained with CFSE and then infected with TMEV. The decrease of CFSE fluorescence in DCs was determined using anti-CD11c antibody at 3 dpi as shown. (E) BM cells from SJL mice were cultured with 4 μl/ml, 40 μl/ml, or 400 μl/ml of UV-inactivated supernatants from TMEV-infected SJL DCs (SJL-sup) or B6 DCs (B6-sup). BM cells were also cultured with rIFN-α, rIFN-β (10 U/ml, 100 U/ml, and 1,000 U/ml), rIFN-γ (0.1 ng/ml, 1 ng/ml, and 10 ng/ml), or rIL-6 (1 ng/ml, 10 ng/ml, and 100 ng/ml). Increasing concentrations of supernatants or cytokines are denoted by the dotted bars, then striped bars, and,finally, the solid bars. Mock-infected SJL DC and B6 DC supernatant (400 μl/ml) and PBS were included as controls (open bars, respectively). Cell numbers in the cultures were analyzed after incubation in GM-CSF-supplemented medium for 6 d. Statistically significant differences between the numbers of DCs treated with mock-infected supernatant or PBS and DCs treated with TMEV-infected supernatant or cytokines, respectively, are indicated with asterisks (*, p < 0.05, **, p < 0.01, ***, p < 0.001).
Figure 5
Figure 5. Reduced Number and Ability of DCs to Produce Cytokines in TMEV-Infected SJL Mice
(A) The percentage of CD45hiCD11c+ cells (relative to total CD45hi cells) and the total number of DC cells in the CNS of virus-infected mice (three mice per group) were determined at 3 and 5 dpi. Differences between virus-infected SJL and B6 mice are significant (**, p < 0.01). (B) CNS-infiltrating cells from virus-infected mice (three mice per group) at 5 dpi were stimulated with PBS or LPS for 6 h and then stained for CD11c and IL-12. Data are gated on CD11c+ cells. The percentage of TNF-α- or IL-12-positive cells relative to total CD11c+ cells is indicated. (C) Splenocytes from mock-infected or TMEV-infected mice were prepared at 7 dpi, then stimulated with PBS or LPS for 6 h and stained for CD11c, CD8α and IL-12. Data are shown with gated CD11c+ cells. (D) DCs purified from the spleens of mock-infected or TMEV-infected mice at 7 dpi were stimulated with GM-CSF overnight, followed by incubation with PBS or LPS for the final 6 h. IL-12p40 was determined by ELISA. Statistically significant differences from the values of mock-infected mice are indicated with asterisks (*, p < 0.05).
Figure 6
Figure 6. Inhibition of Allogenic T Cell Stimulation by TMEV-Infected DCs
BM DCs were infected with TMEV in vitro for 3 d, and then varying numbers of unfixed or fixed BM DCs were cultured with 1 × 10⁵ of naïve T cells from BALB/c mice. To study in vivo infected cells, DCs were isolated from the spleens of mock- or TMEV-infected mice at 7 dpi, then co-cultured with naïve T cells. Cells and culture supernatants were collected after 96 h of co-culture. (A, B) T cell proliferation was measured as the mean ± SD of (3H)-thymidine uptake from triplicate cultures. (C, D) IFN-γ and IL-4 produced in culture supernatants (DC:T = 1:10) were determined by ELISA. UD, undetectable. **, significant differences between the values in TMEV- and mock-infected cultures (p < 0.01). Data from BM DCs infected in vitro are shown in (C), and those from infected mice in (D). (E, F) The effect of co-culture with infected DCs on the expression of CD69 or TIM-3 on T cells (DC:T = 1:10) was determined by FACS. The numbers represent the percentage of CD69- or TIM-3-positive cells relative to total CD4+ or CD8+ T cells.
Figure 7
Figure 7. Enhanced CTL Responses, Viral Clearance, and Protection from Demyelinating Disease following DC Transfer into Susceptible Mice
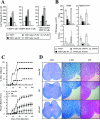
BM DCs pretreated with LPS for 6 h (LPS-DCs), untreated DCs, and non-DC splenocytes (1 × 10⁵ cells/per mouse) together with TMEV (1 × 10⁶ pfu/mouse) or virus alone (no DC) were intracerebrally injected into SJL mice. (A) Assessment of levels of CD45hi cells, CD45hiCD11b+ cells, and virus-reactive CD8+ T cells in the CNS of virus-infected mice (three mice per group) at 7 dpi. *, p < 0.05 and **, p < 0.01 compared to values in mice infected with virus alone. n.d., not done. (B) Level of viral persistence in brains or spinal cords (three mice per group) was assessed by plaque assay at 7 and 21 dpi. UD (undetectable) represents virus levels lower than 24 pfu/per tissue. *, p < 0.05 and **, p < 0.01 between the experimental groups and the control group infected with virus alone. (C) Disease courses of SJL mice infected with virus plus non-DC splenocytes (n = 13), DCs (n = 15), or LPS-DCs (n = 15) were monitored. Data are presented as the percentage of mice affected with a score of 1 or greater and the mean severity score and standard deviation of their clinical manifestations. (D) Spinal cords of infected mice at 50 dpi were stained with luxol fast blue (LFB) and hematoxylin-eosin (HE), and then examined under a light microscope. The middle and right panels show enlarged images of the left micrographs. Scale bar = 100 μm.
Figure 8
Figure 8. Schematic Presentation of the Potential Role of DCs in Differential Susceptibility to Viral Persistence
TMEV preferentially infects immature DCs and induces the production of anti-viral IFN-α/β, IFN-γ, and unknown cytokines. DCs from susceptible mice are more permissive to viral infection and viral-induced apoptosis, and produce higher levels of these cytokines compared to DCs from resistant mice. These cytokines inhibit the development of DCs from BM cells in a dose-dependent manner, leading to arrested maturation and compromised function, while these cytokines can be protective when exposed to DCs prior to viral infection. Consequently, susceptible mice exhibit severely reduced levels of functionally mature DCs for T cell activation, resulting in poor anti-viral T cell responses, and perhaps, preferential non-protective or pathogenic T cell responses. Adoptive transfer of LPS-pre-activated syngeneic DCs, which are resistant to viral infection, renders susceptible mice resistant to viral-induced demyelinating disease by elevating protective T cell responses.

Similar articles

Cited by

References

    1. Hill AV. The immunogenetics of human infectious diseases. Annu Rev Immunol. 1998;16:593–617. - PubMed
    1. Beutler B, Jiang Z, Georgel P, Crozat K, Croker B, et al. Genetic analysis of host resistance: Toll-like receptor signaling and immunity at large. Annu Rev Immunol. 2006;24:353–389. - PubMed
    1. Granucci F, Foti M, Ricciardi-Castagnoli P. Dendritic cell biology. Adv Immunol. 2005;88:193–233. - PubMed
    1. Dal Canto MC, Kim B.S, Miller S.D, Melvold R.W. Theiler's murine encephalomyelitis virus (TMEV)-induced demyelination: A model for human multiple clerosis. Methods. 1996;10:453–461. - PubMed
    1. Trottier M, Schlitt BP, Kung AY, Lipton HL. Transition from acute to persistent Theiler's virus infection requires active viral replication that drives proinflammatory cytokine expression and chronic demyelinating disease. J Virol. 2004;78:12480–12488. - PMC - PubMed

Publication types

MeSH terms