. 2007 Aug;3(8):e138.
doi: 10.1371/journal.pgen.0030138. Epub 2007 Jul 5.

Genome analysis of Minibacterium massiliensis highlights the convergent evolution of water-living bacteria

Affiliations

Genome analysis of Minibacterium massiliensis highlights the convergent evolution of water-living bacteria

Stéphane Audic et al. PLoS Genet. 2007 Aug.

Abstract

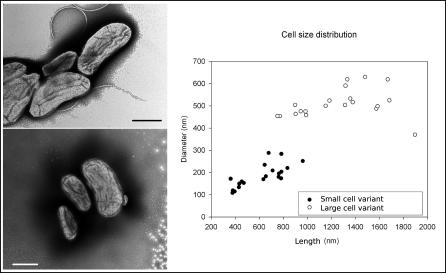
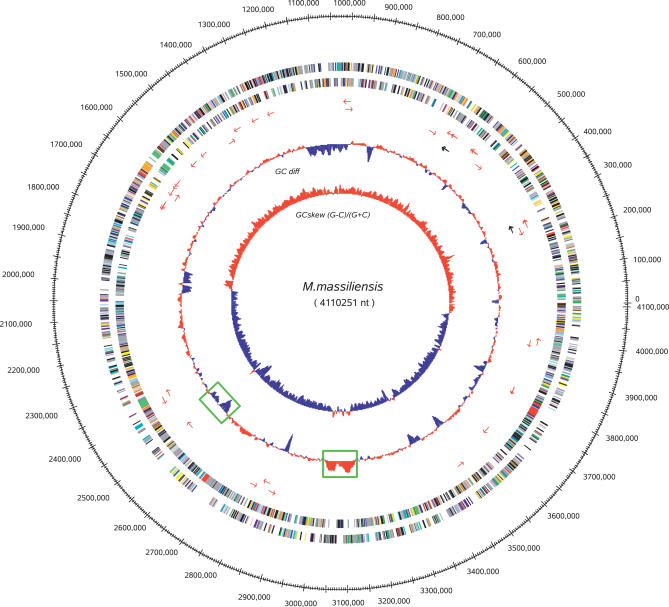
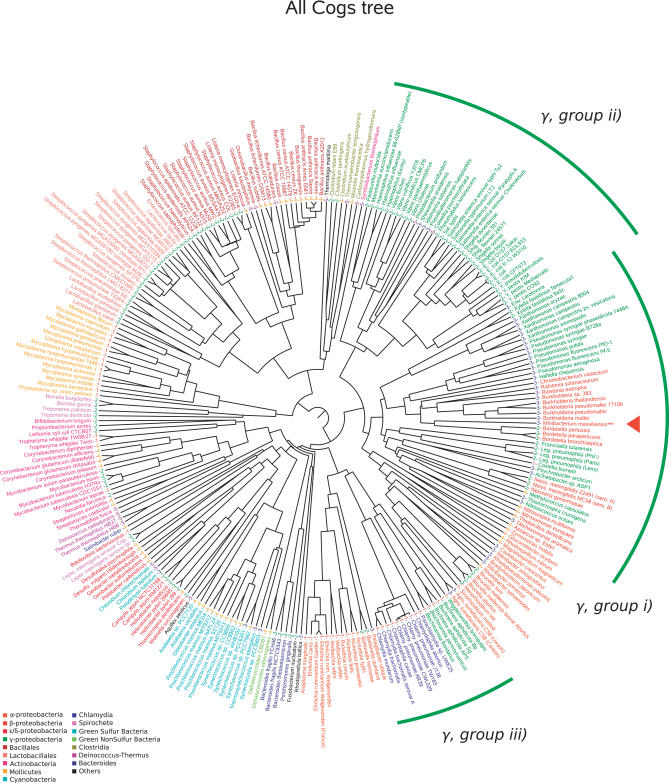
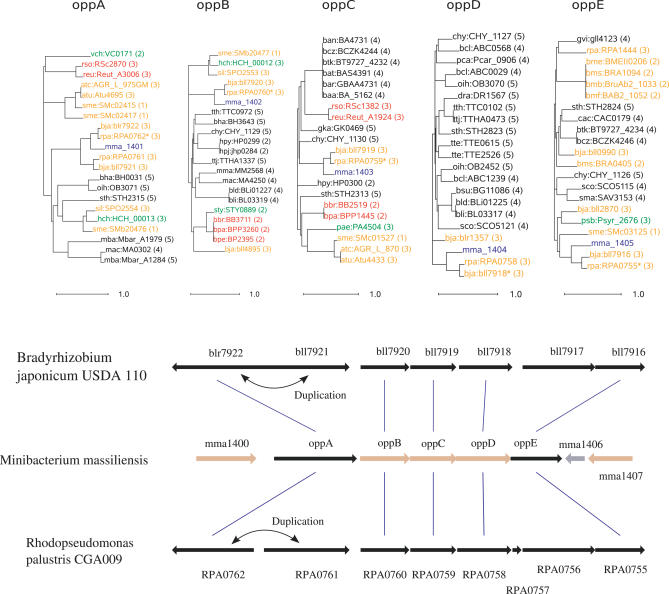
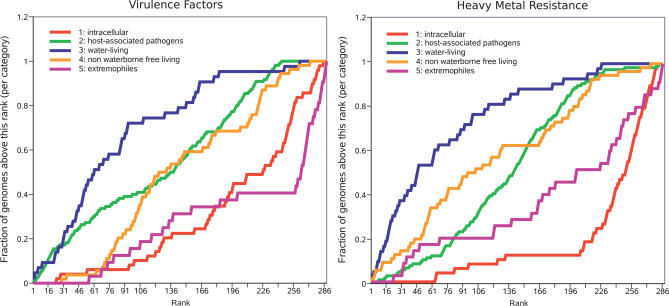
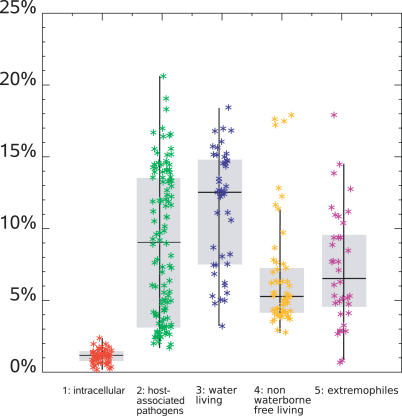
Filtration usually eliminates water-living bacteria. Here, we report on the complete genome sequence of Minibacterium massiliensis, a beta-proteobacteria that was recovered from 0.22-mum filtered water used for patients in the hospital. The unexpectedly large 4,110,251-nucleotide genome sequence of M. massiliensis was determined using the traditional shotgun sequencing approach. Bioinformatic analyses shows that the M. massiliensis genome sequence illustrates characteristic features of water-living bacteria, including overrepresentation of genes encoding transporters and transcription regulators. Phylogenomic analysis based on the gene content of available bacterial genome sequences displays a congruent evolution of water-living bacteria from various taxonomic origins, principally for genes involved in energy production and conversion, cell division, chromosome partitioning, and lipid metabolism. This phylogenomic clustering partially results from lateral gene transfer, which appears to be more frequent in water than in other environments. The M. massiliensis genome analyses strongly suggest that water-living bacteria are a common source for genes involved in heavy-metal resistance, antibiotics resistance, and virulence factors.


Conflict of interest statement

Competing interests. The authors have declared that no competing interests exist.

Figures

Figure 1
Figure 1. Transmission Electron Microscopy Featuring SCV and LCV of M. massiliensis
LCV measured 1,259 + 329 × 510 + 65 nm and SCV measured 615 + 185 × 185 + 52 nm. The distribution of length and diameter of organisms in the M. massiliensis cell population is also shown. (Bar = 500nm)
Figure 2
Figure 2. Map of the M. massiliensis Chromosome
The following features are displayed (from the outside in): position along the genome, protein-coding genes along both strands colored according to COG categories, tRNA genes as red arrows, rRNA genes as black arrows, the windowed difference of GC% with respect to the average, and the GC skew (G − C)/(G + C), with positive values in red and negative values in blue. Two regions of phage insertion are indicated by green boxes.
Figure 3
Figure 3. All COG Phylogenomic Representations
Organisms are colored according to taxonomy. The class membership of the organisms is also indicated: (1) obligate intracellular bacteria including endosymbionts, (2) pathogens and host-associated bacteria (3) waterborne free-living bacteria, (4) nonwaterborne, free-living bacteria, and (5) extremophiles. The position of M. massiliensis is indicated by a red triangle in the tree.
Figure 4
Figure 4. En-Bloc Gene Transfer
Phylogenetic trees for five consecutive genes in M. massiliensis illustrating lateral gene transfer with α-proteobacteria. Genes are labeled according to their names in the Kegg database, followed by the environmental category of the organism. The gene order is conserved among the three species, except for OppA, duplicated in B. japonicum and R. palustris. In this tree, gene names are colored according to the following code: M. massiliensis, blue; α-proteobacteria, yellow; β-proteobacteria, red; γ-proteobacteria, green; and others, black. The trees were built using a maximum likelihood substitution model and midpoint rooting.
Figure 5
Figure 5. Prevalence of Virulence Factors and Heavy-Metal Resistance Genes in Water-Living Bacteria
Organisms are ranked according to the number of hits to the virulence factor database or the heavy-metal resistance database (Materials and Methods) they exhibited per unit length of genome size. For each rank, the fraction of organisms in this category with the same rank or below is plotted. The lifestyle categories are the same as those in Figure 3. In this representation, we show that the genomes of water-living organisms tend to rank higher, showing a higher density of virulence factors and heavy-metal resistance genes.
Figure 6
Figure 6. Distribution of Putative LGTs
Organisms are colored according to lifestyle, which are the same as in Figure 3.

Similar articles

Cited by

References

    1. Kulakov LA, McAlister MB, Ogden KL, Larkin MJ, O'Hanlon JF. Analysis of bacteria contaminating ultrapure water in industrial systems. Appl Environ Microbiol. 2002;68:1548–1555. - PMC - PubMed
    1. Poindexter JS. Oligotrophy - fast and famine existence. Adv Microb Ecol. 1981;5:63–89.
    1. Iizuka T, Yamanaka S, Nishiyama T, Hiraishi A. Isolation and phylogenetic analysis of aerobic copiotrophic ultramicrobacteria from urban soil. J Gen Appl Microbiol. 1998;44:75–84. - PubMed
    1. Miyoshi T, Iwatsuki T, Naganuma T. Phylogenetic characterization of 16S rRNA gene clones from deep-groundwater microorganisms that pass through 0.2-micrometer-pore-size filters. Appl Environ Microbiol. 2005;71:1084–1088. - PMC - PubMed
    1. Vacca DJ, Bleam WF, Hickey WJ. Isolation of soil bacteria adapted to degrade humic acid-sorbed phenanthrene. Appl Environ Microbiol. 2005;71:3797–3805. - PMC - PubMed

Publication types

Associated data

LinkOut - more resources