. 2007 Oct 19;282(42):30452-65.
doi: 10.1074/jbc.M703091200. Epub 2007 Aug 27.

Glutathione depletion is necessary for apoptosis in lymphoid cells independent of reactive oxygen species formation

Affiliations

Glutathione depletion is necessary for apoptosis in lymphoid cells independent of reactive oxygen species formation

Rodrigo Franco et al. J Biol Chem. .

Abstract

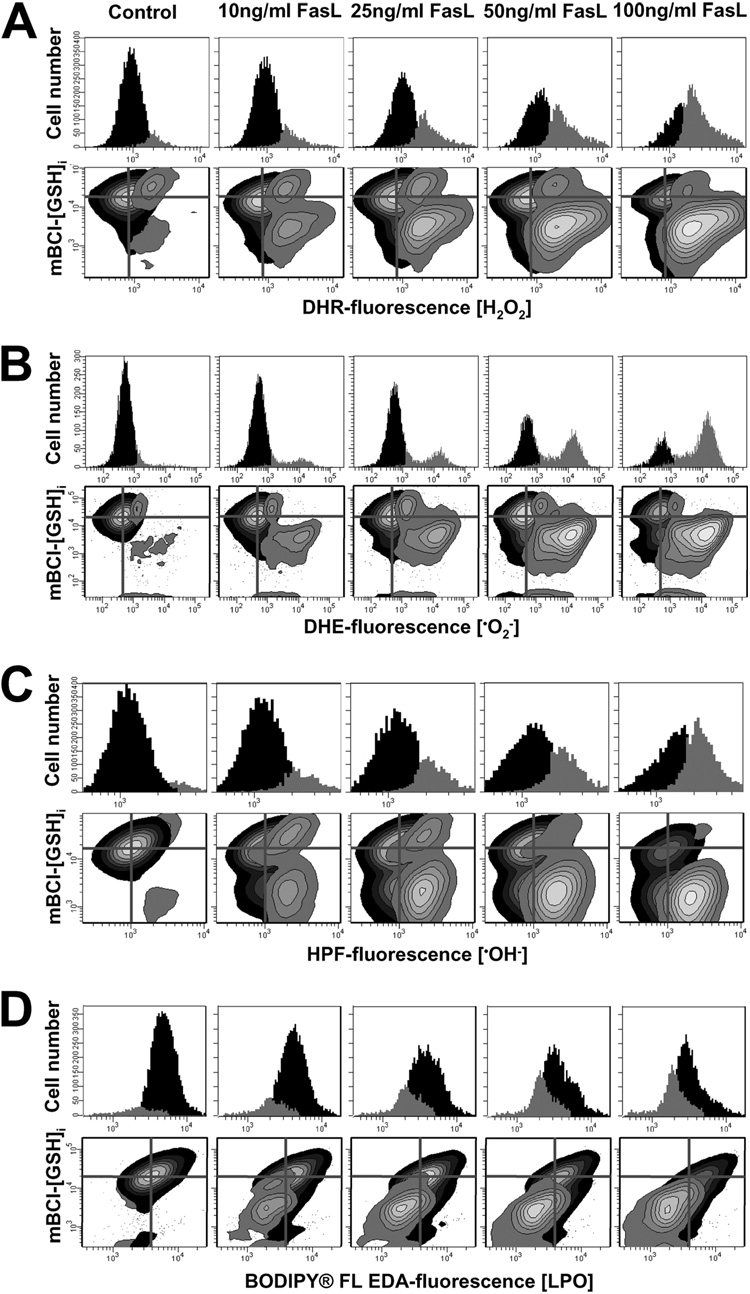
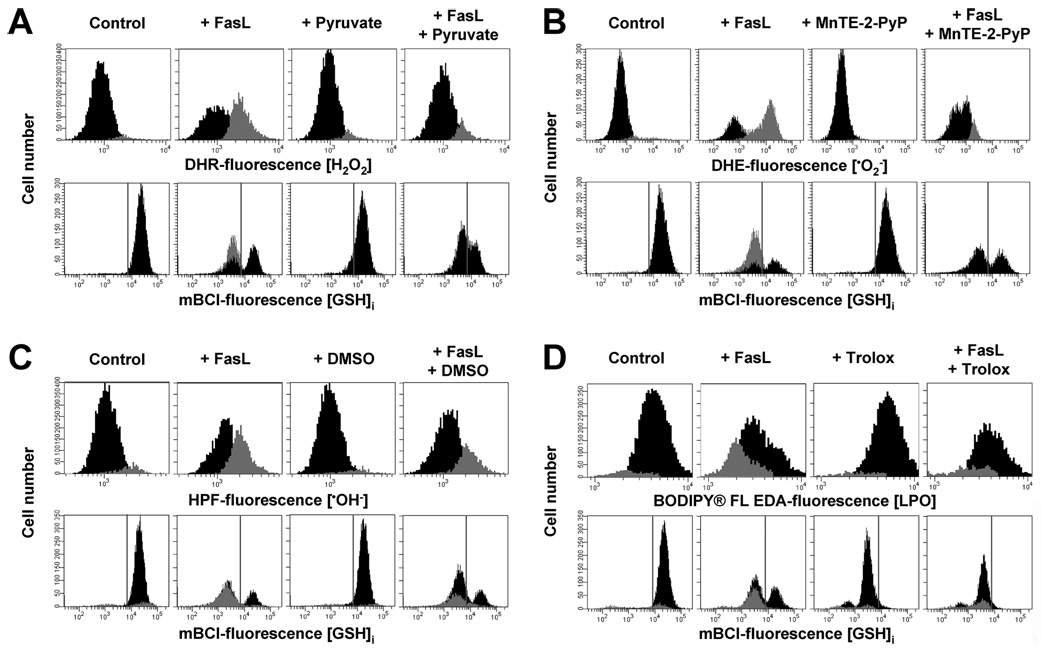
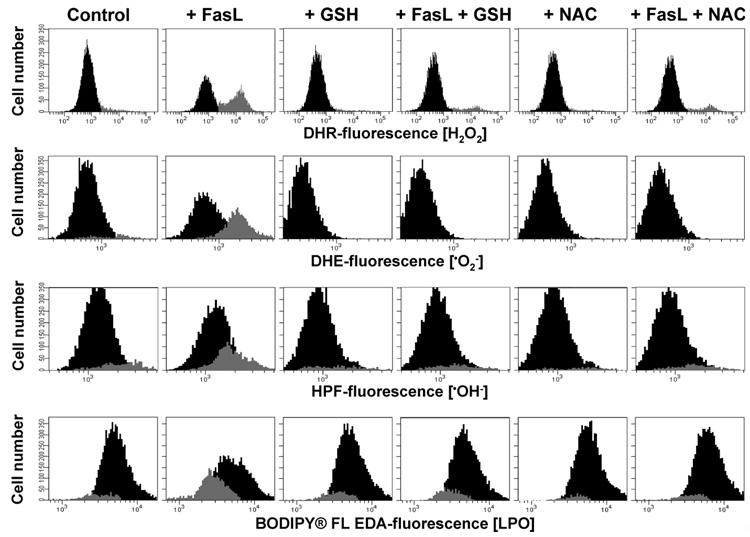
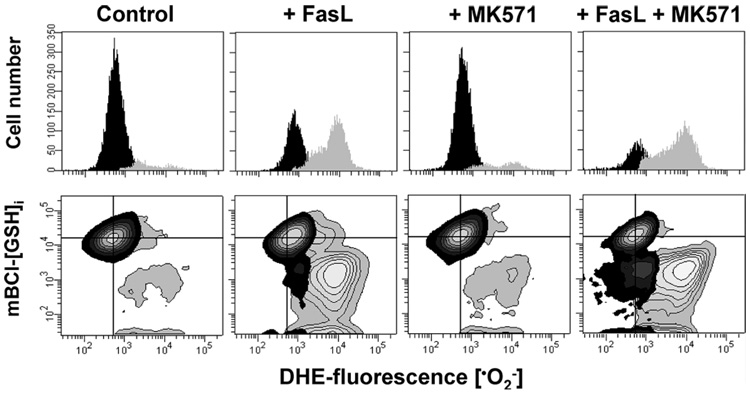
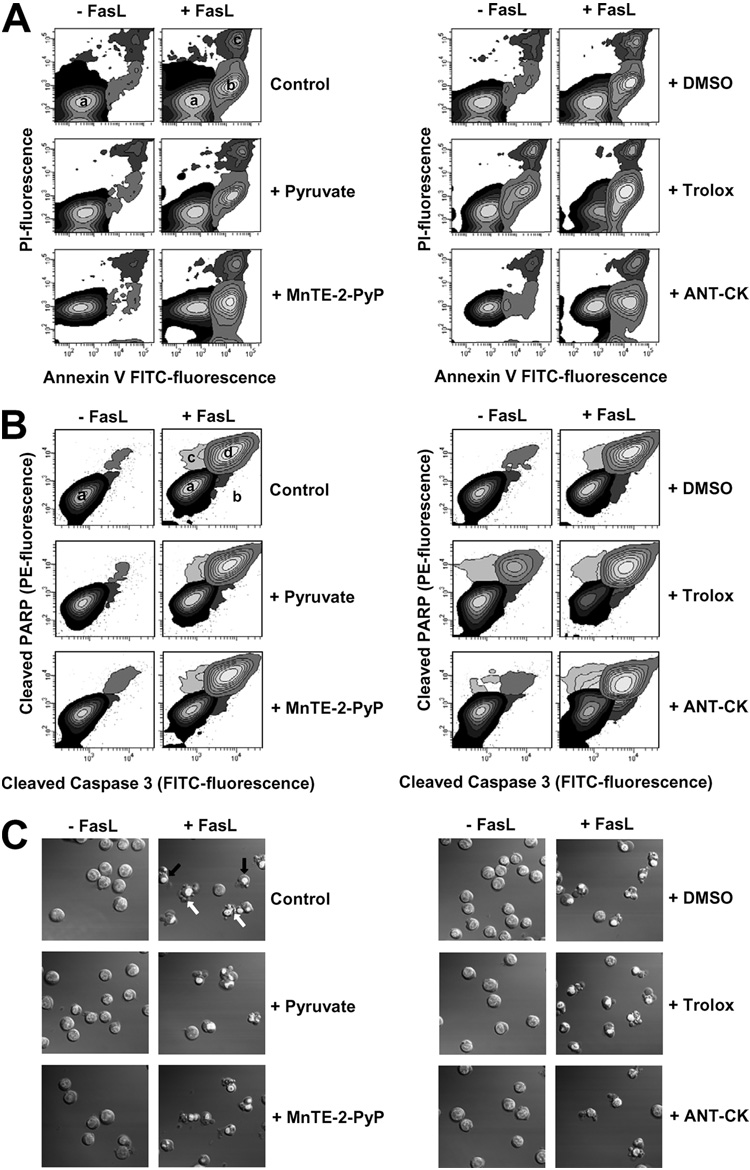
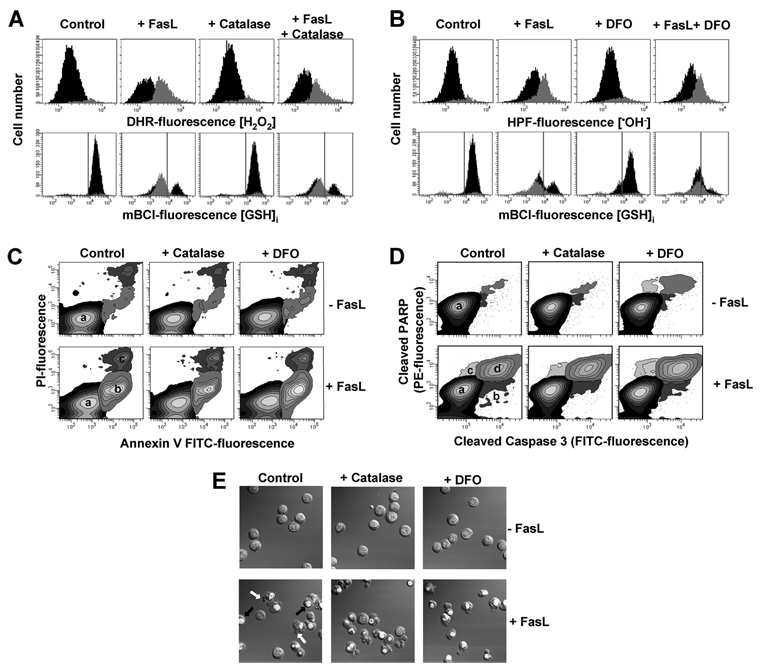
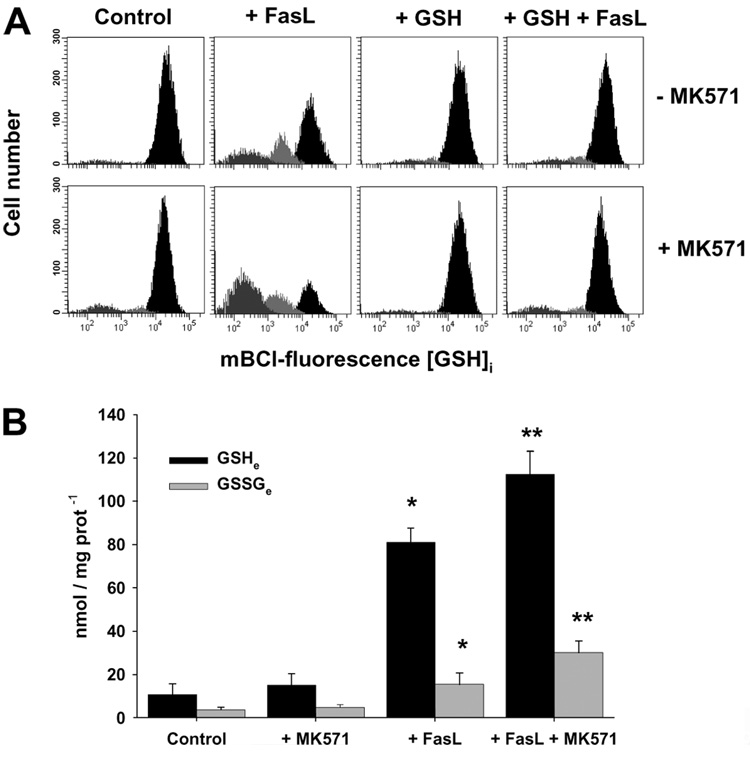
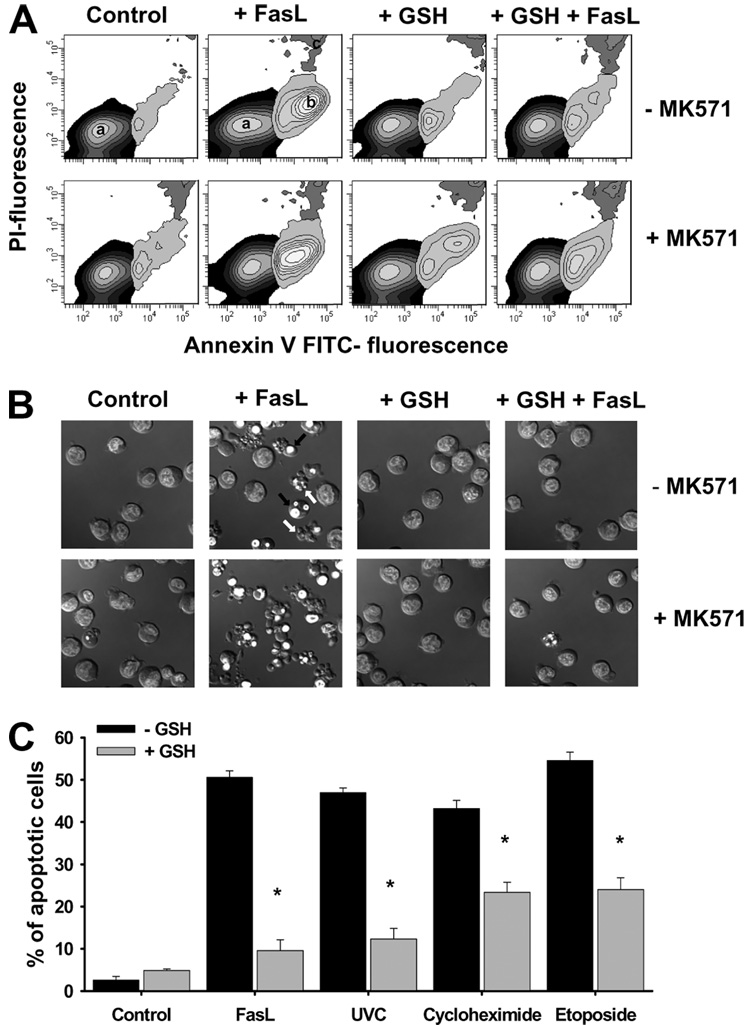
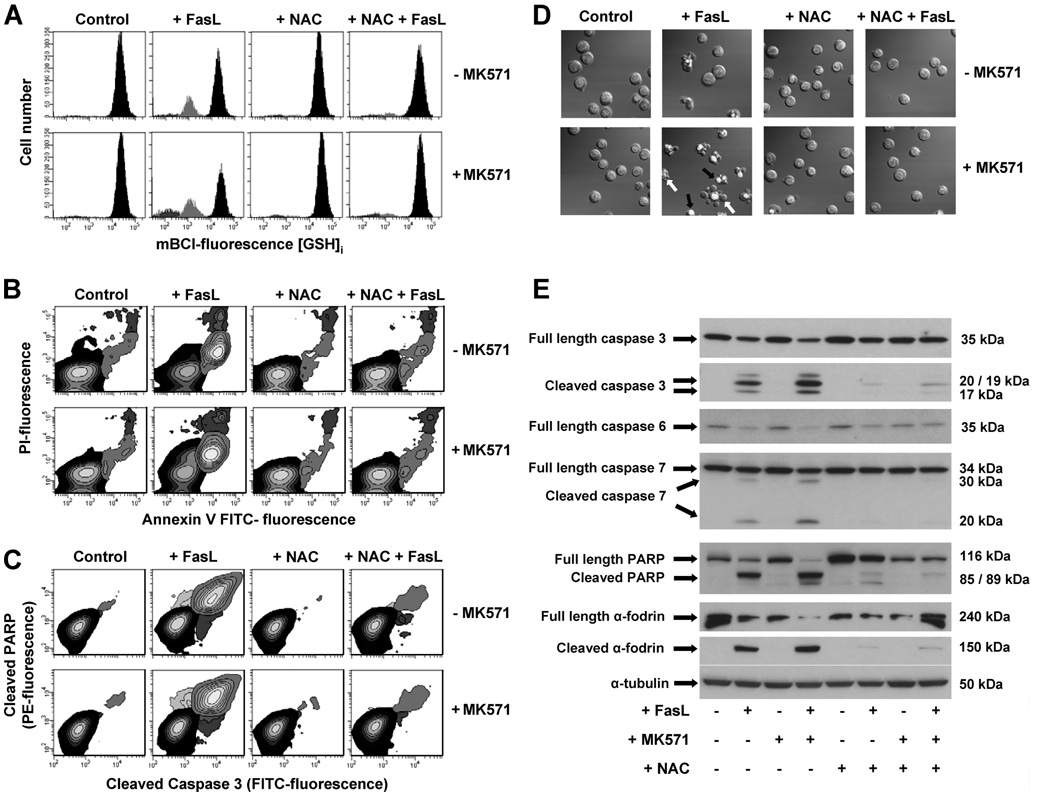
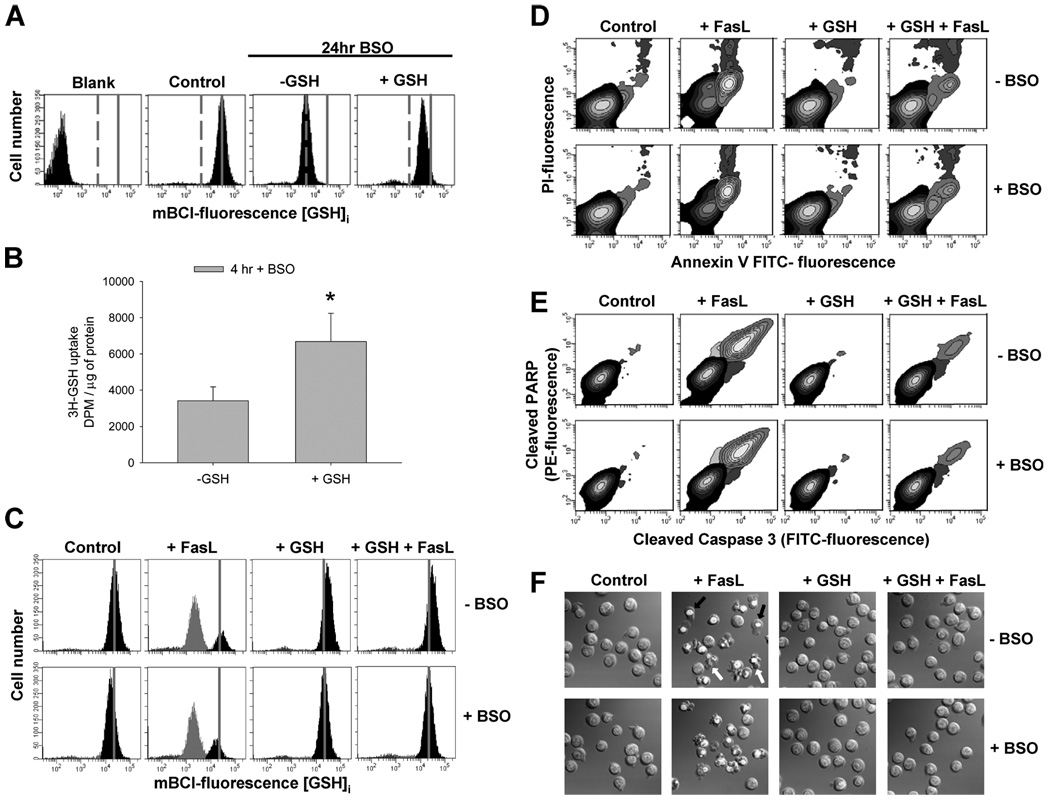
Changes in the intracellular redox environment of cells have been reported to be critical for the activation of apoptotic enzymes and the progression of programmed cell death. Glutathione (GSH) depletion is an early hallmark observed in apoptosis, and we have demonstrated that GSH efflux during death receptor-mediated apoptosis occurs via a GSH transporter. We now evaluate the relationship between GSH depletion, the generation of reactive oxygen species (ROS), and the progression of apoptosis. Simultaneous single cell analysis of changes in GSH content and ROS formation by multiparametric FACS revealed that loss of intracellular GSH was paralleled by the generation of different ROS including hydrogen peroxide, superoxide anion, hydroxyl radical, and lipid peroxides. However, inhibition of ROS formation by a variety of antioxidants showed that GSH loss was independent from the generation of ROS. Furthermore, GSH depletion was observed to be necessary for ROS generation. Interestingly, high extracellular thiol concentration (GSH and N-acetyl-cysteine) inhibited apoptosis, whereas, inhibition of ROS generation by other non-thiol antioxidants was ineffective in preventing cell death. Finally, GSH depletion was shown to be a necessary for the progression of apoptosis activated by both extrinsic and intrinsic signaling pathways. These results document a necessary and critical role for GSH loss in apoptosis and clearly uncouple for the first time GSH depletion from ROS formation.


Figures

FIGURE 1
FIGURE 1. Reactive oxygen species generation correlates with changes in intracellular glutathione, GSHi
Reactive oxygen species formation was assessed by FACS using DHR for H2O2 detection; DHE for superoxide anion (O2); HPF for hydroxyl radical (OH); and BODIPY® FL EDA, for LPO. Changes in intracellular glutathione concentration GSHi were determined by FACS using the thiol binding dye monochlorobimane, mBCl. For the induction of apoptosis, Jurkat cells were incubated with FasL for 4 h at the concentration indicated. Data are expressed as changes in ROS-sensitive dye fluorescence represented by frequency histograms (upper panels in A–D) or in contour plots versus changes in mBCl fluorescence (GSHi) (lower panels in A–D). In contour plots, the quadrant center was set at the mean fluorescence intensity for mBCl and the corresponding ROS dye, as a reference to indicate basal levels of GSHi and ROS. Populations were gated and represented according to the differences in ROS levels. Plots are representative of n = 3 independent experiments.
FIGURE 2
FIGURE 2. Reactive oxygen species scavenging by antioxidants does not affect FasL-induced GSH loss
Reactive oxygen species formation and changes in GSHi were assessed by FACS. Apoptosis was induced in Jurkat cells by incubation with FasL (50 ng/ml FasL) for 4 h. The effect of the antioxidants 10 mm sodium pyruvate (for H2O2) (A), 2% Me2SO (OH) (B), 250 µm MnTE-2-PyP (O2) (C), and 5 mm trolox (LPO) (D), was individually assessed. Jurkat cells were preincubated in RPMI for 1 h at 37 °C with the agents dissolved in either Me2SO or ethanol, and antioxidants remained throughout the experiment. In all cases, control conditions include vehicles at the same concentration. Populations were gated according to the differences in ROS levels. Data are expressed as frequency histograms of either changes in the fluorescence of the ROS-sensitive dyes (upper panels A–C) or mBCl (lower panels A–C). In A–C lower panels, GSH depletion is depicted as the appearance of a population of cells at the left of the gray solid lines. For mBCl fluorescence the solid line depicts the plots representative of n = 3 independent experiments.
FIGURE 3
FIGURE 3. Glutathione depletion is necessary for ROS formation
Jurkat cells were incubated with FasL (50 ng/ml FasL) for 4 h in the presence or absence of high extracellular GSH medium (25 mm) or NAC (10 mm). Media was switched at the time of FasL stimuli. High glutathione (+GSH) and N-acetyl-cysteine (+NAC) medium was made by substitution of NaCl, maintaining the isomolarity of the media. Reactive oxygen species formation was assessed by FACS as explained under "Experimental Procedures" and gated and expressed as in Fig. 2. Plots are representative of at least n = 3 independent experiments.
FIGURE 4
FIGURE 4. Stimulation of GSH depletion enhances ROS formation
Superoxide anion (O2) formation (used as a marker of oxidative stress) and changes in GSHi were assessed by FACS as in Fig. 1. Apoptosis was induced in Jurkat cells by incubation with FasL (50 ng/ml FasL) for 4 h in the presence or absence of 50 µm MK571. Data are expressed as changes in DHE-fluorescence (O2) represented by frequency histograms (upper panels), or in contour plots versus changes mBCl fluorescence (GSHi) (lower panels). In contour plots, the quadrant center was set at the mean fluorescence intensity for mBCl and the corresponding ROS dye, as a reference to indicate basal levels of GSHi and ROS. Populations were gated and represented according to the differences in DHE fluorescence or O2 content, as in Fig. 1B. Plots are representative of n = 3 independent experiments.
FIGURE 5
FIGURE 5. Reactive oxygen species do not modulate FasL-induced apoptosis
FasL-induced apoptosis was assessed by (A) phosphatidylserine externalization and loss of plasma membrane integrity (cell viability); (B) simultaneous detection of cleaved caspase 3 and PARP by FACS; as well as by (C) changes in morphological hallmarks of apoptosis which include nuclear condensation, plasma membrane blebbing, and cellular fragmentation. Apoptosis was induced by 50 ng/ml FasL over 4 h. The effect of sodium pyruvate (10 mm), Me2SO (2%), MnTE-2-PyP (250 µm), trolox (5 mm) was individually assessed or in conjunction (ANT-CK). In A, early externalization of phosphatidylserine is shown as an increase in the number of cells that had an increase in annexin V-FITC fluorescence (population b), prior to the loss of membrane integrity or high PI fluorescence with respect to control cells (population a). Loss of plasma membrane integrity or cell viability in later stages of apoptosis is reflected as an increase in both PI and FITC fluorescence (population c). The contour plots are representative of a single experiment representative of n = 3. In B, contour plots in control panels show the distribution of cells with background fluorescence for FITC-conjugated anti-cleaved caspase 3, or PE-conjugated anti-cleaved PARP antibodies (population a, black). Simultaneous cleavage of caspase 3 and PARP during apoptosis is reflected as a coincident increase in the fluorescence for FITC and PE (population d, gray). Other less represented populations indicate cells which are positive for either cleaved caspase 3 (population b, dark gray) or cleaved PARP (population c, light gray) antibodies respectively, which never reach more than 10% of the total sample. Plots are representative of at least n = 3 independent experiments. In C, DIC images were obtained to analyze changes in cell morphology during apoptosis. Nuclei condensation is observed as a picnotic and brighter nuclei of cells stained with Hoechst 3342 (see black arrows for examples). Examples of cells fragmented or with plasma membrane blebs are pointed by white arrows. Images are representative of at least three independent experiments.
FIGURE 6
FIGURE 6. Catalase and deferoxamine are ineffective against ROS formation and apoptosis
Apoptosis was induced in Jurkat cells by incubation with FasL (50 ng/ml FasL) for 4 h in the presence or absence of 1000 milliunits/ml catalase (bovine liver) or 1 mm desferoxamine mesylate. Jurkat cells were preincubated in RPMI for 1 h at 37 °C with the agents, and antioxidants remained throughout the experiment. In all cases, control conditions include vehicles at the same concentration. A and B, simultaneous analysis of changes in GSH content and generation of H2O2 or OH was performed by FACS. Data are expressed as in Fig. 2. FasL-induced apoptosis was assessed by (C) phosphatidylserine externalization and loss plasma membrane integrity; (D) simultaneous detection of cleaved caspase 3 and PARP; and (E) DIC images depicting nuclear condensation, plasma membrane blebbing, and cellular fragmentation. Results are expressed as in Fig. 5. Plots and images are representative of n = three independent experiments.
FIGURE 7
FIGURE 7. Glutathione loss is mediated by a plasma membrane transport, which is stimulated by MK571 and inhibited by high extracellular GSH medium
A, changes in GSHi were determined by FACS. Effect of 4 h of treatment with 25 ng/ml FasL on the GSHi of Jurkat cells. Populations were gated according to their GSHi levels on an mBCl fluorescence versus forward scatter plot as explained under "Experimental Procedures." Plots are representative of at least four independent experiments. B, extracellular determinations of reduced (GSH) and oxidized (GSSG) glutathione. Cells (2 × 10⁷ cells/ml) were incubated (1 h) with acivicin (250 µm), and then, stimulated with FasL (100 ng/ml) for 2 h with or without MK571 (50 µm). Samples were centrifuged, and aliquots of the media were taken to determine changes in extracellular (e) levels of GSH and GSSG. Results are normalized to protein concentration for each sample and are means of n = 4 ± ES. *, p < 0.05, against corresponding control values; **, p < 0.05 against corresponding FasL values.
FIGURE 8
FIGURE 8. Glutathione transport regulates apoptosis induced by distinct stimuli
For the induction of apoptosis, Jurkat cells were incubated with 25 ng/ml FasL for the time indicated. Data are expressed as frequency histograms of mBCl fluorescence. MK571 (50 µm) and high extracellular GSH medium (+GSH) were added at the time of FasL stimuli. In A, apoptosis was assessed by phosphatidylserine externalization using annexin-FITC staining as explained under "Experimental Procedures." Plots are representative of at least n = 4 independent experiments, and in B, DIC images were obtained to analyze changes in cell morphology during apoptosis. Images are representative of at least three independent experiments (see Fig. 5). In C, the effect of high extracellular GSH on apoptosis induced by 8 h exposure of FasL (25 ng/ml), UVC radiation (15 mJ/cm²), cycloheximide (30 µm), and etoposide (100 µm) was studied. Apoptosis was assessed by the % of cells with cleaved caspase 3 assessed by FACS as in Fig. 5. Data are expressed as mean ± S.E. of n = 3. *, p < 0.005 against treatments in the absence of high extracellular GSH (−GSH).
FIGURE 9
FIGURE 9. N-acetyl-l-cysteine protects against FasL-induced GSH depletion and apoptosis
Apoptosis was induced in Jurkat cells by incubation with 25 (A) and 50 (B–E) ng/ml FasL for 4 h. MK571 (50 µm) and high extracellular NAC medium (+NAC) were added at the time of FasL stimuli. A, changes in GSHi were determined by FACS. Populations were gated according to their GSHi levels on an mBCl fluorescence versus forward scatter plot as explained under "Experimental Procedures." FasL-induced apoptosis was assessed by (B) phosphatidylserine externalization and loss of plasma membrane integrity; (C) simultaneous detection of cleaved caspase 3 and PARP; (D) DIC images depicting nuclear condensation, plasma membrane blebbing, and cellular fragmentation; and (E) immunoblot detection of full-length and cleaved forms of execution caspases 3, 6, and 7, as well as their substrates PARP and α-fodrin. Results are expressed as in Fig. 5. Plots, images, and blots are representative of n = 3 independent experiments.
FIGURE 10
FIGURE 10. High extracellular GSH protects against FasL-induced GSH depletion and apoptosis independent of de novo synthesis
The role of de novo GSH synthesis in the protective effects of high extracellular GSH was evaluated using BSO (1 mm) an inhibitor of the γGCS. In A, cells were treated with BSO for 24 h (−GSH). This, significantly depleted cells of GSHi compared with control cells (control panel). When GSH-depleted cells were preincubated for 4 h prior to FACS analysis with high GSH medium (+GSH), the GSHi pool was replenished even in the presence of BSO. In B, Jurkat cells were preincubated with 1 µCi of ³H-GSH in the presence of 250 µm acivicin and BSO, with or without of high extracellular GSH. Data are expressed as the amount of radioactivity uptaken by the cells (dpm), normalized by protein concentration per sample. *, p < 0.05, against −GSH values. In C–F, apoptosis was induced in Jurkat cells by incubation with 50 ng/ml FasL for 4 h. High extracellular GSH medium (+GSH) was added at the time of FasL stimuli. C, changes in GSHi were determined by FACS. Populations were gated according to their GSHi levels on an mBCl fluorescence versus forward scatter plot as explained under "Experimental Procedures." After 4 h, BSO starts depleting cells of GSHi, which is prevented by high extracellular GSH medium. For reference, grey solid lines in A and C depict the medium fluorescence intensity of mBCl in control cells, which reflects basal levels of GSH; grey dashed lines in A depict the medium fluorescence intensity of mBCl in BSO-treated cells, which reflects depleted levels of intracellular GSH. FasL-induced apoptosis was assessed by (D) phosphatidylserine externalization and loss of plasma membrane integrity; (E) simultaneous detection of cleaved caspase 3 and PARP; (F) DIC images depicting nuclear condensation, plasma membrane blebbing, and cellular fragmentation. Cells were pretreated with BSO 1 h before the experiment, and it was present throughout the experiment. Results are expressed as in Fig. 5. BSO in B–F was preincubated for 1 h and was present throughout the experiments. Plots and images are representative of n = 3 independent experiments.

Similar articles

Cited by

References

    1. Green DR. Immunol. Rev. 2003;193:5–9. - PubMed
    1. Fadeel B, Orrenius S. J. Intern. Med. 2005;258:479–517. - PubMed
    1. Brunner T, Wasem C, Torgler R, Cima I, Jakob S, Corazza N. Semin. Immunol. 2003;15:167–176. - PubMed
    1. Bortner CD, Cidlowski JA. Cell Death Differ. 2002;9:1307–1310. - PubMed
    1. Franco R, Bortner CD, Cidlowski JA. J. Membr. Biol. 2006;209:43–58. - PubMed

Publication types

MeSH terms

LinkOut - more resources