. 2007 Sep 3;204(9):2145-57.
doi: 10.1084/jem.20070321. Epub 2007 Aug 27.

Thymic selection pathway regulates the effector function of CD4 T cells

Affiliations

Thymic selection pathway regulates the effector function of CD4 T cells

Wei Li et al. J Exp Med. .

Abstract

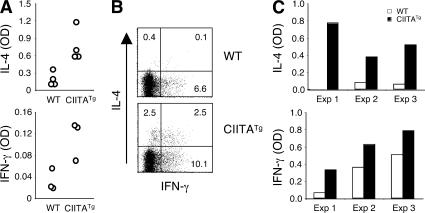
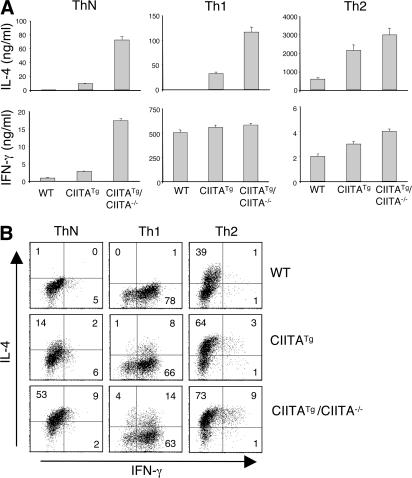
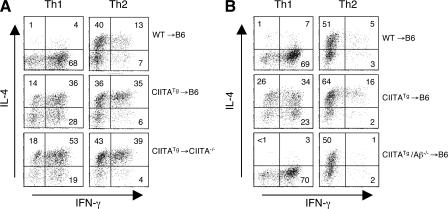
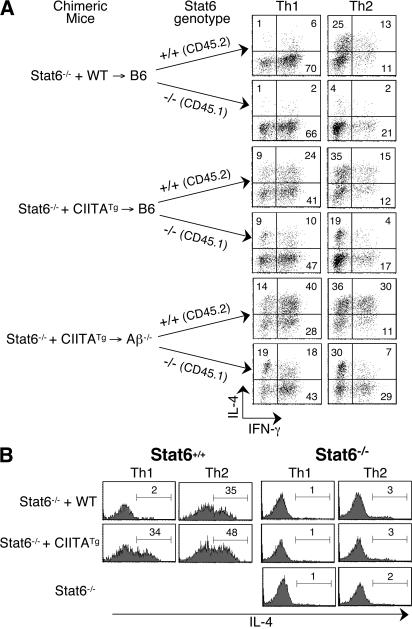
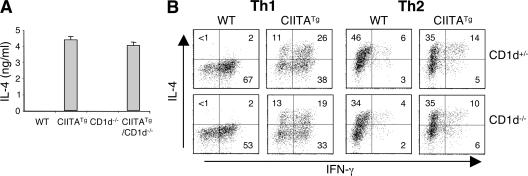
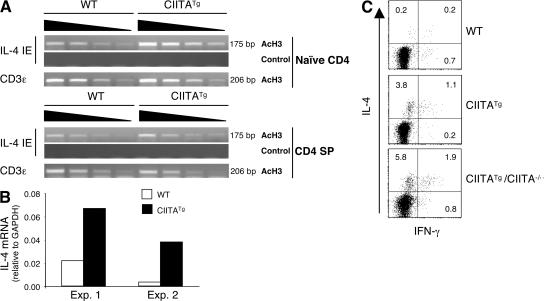
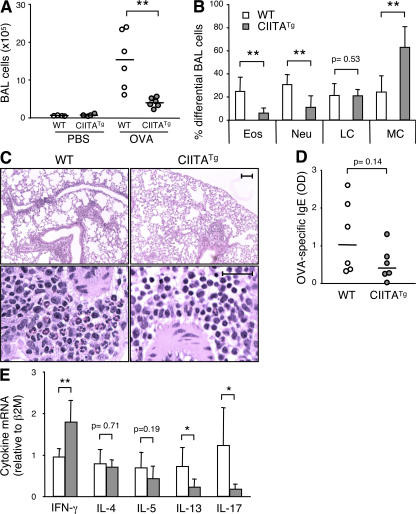
Recently, a new developmental pathway for CD4 T cells that is mediated by major histocompatibility complex class II-positive thymocytes was identified (Choi, E.Y., K.C. Jung, H.J. Park, D.H. Chung, J.S. Song, S.D. Yang, E. Simpson, and S.H. Park. 2005. Immunity. 23:387-396; Li, W., M.G. Kim, T.S. Gourley, B.P. McCarthy, D.B. Sant'angelo, and C.H. Chang. 2005. Immunity. 23:375-386). We demonstrate that thymocyte-selected CD4 (T-CD4) T cells can rapidly produce interferon gamma and interleukin (IL) 4 upon in vivo and in vitro T cell receptor stimulation. These T-CD4 T cells appear to be effector cells producing both T helper type 1 (Th1) and Th2 cytokines, and they maintain a potential to produce Th2 cytokines under Th1-skewing conditions in a signal transducer and activator of transcription 6-independent manner. The IL-4 mRNA level is high in CD4 single-positive thymocytes if they are selected on thymocytes, which is at least partly caused by enhanced histone acetylation of the IL-4 locus. However, mice that can generate T-CD4 T cells showed attenuated immune responses in an allergen-induced airway inflammation model, suggesting a protective role for T-CD4 T cells during an airway challenge. Our results imply that this thymic selection pathway plays an important role in determining the effector function of the resulting CD4 cells and in regulating immune response.


Figures

Figure 1.
Figure 1.
T-CD4 T cells rapidly produce high levels of IL-4 and IFN-γ. (A) 2 h after tail vein injection of PBS or 10 μg anti-CD3 antibody, WT and CIITATg mice were killed and blood was collected. Cytokine levels in the serum were determined by ELISA. Each symbol in the histograms represents an individual mouse. (B) Splenocytes from the indicated mice were stimulated with PMA and ionomycin for 5 h, followed by ICS. Plots were gated on NK1.1 CD4 T cells. The percentage of positive cells in each quadrant is shown. (C) Splenic CD4 T cells from WT and CIITATg mice were stimulated with anti-CD3 and anti-CD28 for 2 d. Cytokines in the culture supernatants were determined by ELISA. Results from three independent experiments are shown.
Figure 2.
Figure 2.
Th1 cells from T-CD4 T cells produce the Th2 cytokine IL-4 as well as IFN-γ. Sorted naive (CD45RBhiCD44lo) CD4 T cells from WT, CIITATg, and CIITATg/CIITA−/− mice were cultured under neutral, Th1-, or Th2-skewing conditions for 6 d, as described in Materials and methods. Differentiated cells were subsequently restimulated with plate-coated anti-CD3 overnight, and culture supernatants were collected and analyzed for IFN-γ and IL-4 production by ELISA (A). The error bars represent the mean ± SD. For intracellular cytokine analysis (B), differentiated neutral, Th1, or Th2 cells were restimulated with PMA plus ionomycin for 5 h, as described in Materials and methods. After fixation and permeabilization, the cells were stained with PE-conjugated anti–IFN-γ and allophycocyanin-conjugated anti–IL-4 and analyzed by FACS. Numbers in the dot plots represent the percentages of cytokine-positive CD4 T cells. All experiments were repeated at least twice.
Figure 3.
Figure 3.
The CD4 T cell selection pathway is responsible for IL-4–producing Th1 cells. (A) WT→B6, CIITATg→B6, and CIITATg→CIITA−/− chimeric mice were generated as described in Materials and methods. 11 wk after reconstitution, splenic CD4 T cells were differentiated under Th1- or Th2-inducing conditions for 6 d. Differentiated cells were then restimulated with PMA and ionomycin and analyzed for IFN-γ and IL-4 production. (B) CIITA transgene expression in the absence of MHC class II cannot generate IL-4–producing Th1 cells. BM from WT, CIITATg, or CIITATg/Aβ−/− mice were transplanted into lethally irradiated B6 mice. Differentiated Th1 or Th2 cells from the mice reconstituted for 3 mo were assayed for cytokine production by ICS. The percentage of positive cells in each quadrant is shown.
Figure 4.
Figure 4.
Stat6-independent production of IL-4 by T-CD4 T cells. (A) Mixed BM chimeras. BM from Stat6−/− mice were mixed with those from WT or CIITATg mice and cotransferred into B6 or Aβ−/− recipients. Splenic CD4 T cells from mixed BM chimeras were differentiated into Th1 or Th2 cells. Before fixation and permeabilization, Th cells were stained with an anti-CD45.2 mAb to distinguish T cells derived from Stat6−/− BM (CD45.1+) as opposed to those from Stat6+/+ BM (CD45.2+). Cytokine production profiles were subsequently assayed by ICS. Mice were analyzed 10 wk after BM transplantation. The percentage of positive cells in each quadrant is shown. (B) Co-culturing Stat6−/− CD4 T cells with CIITATg CD4 T cells during in vitro Th cell differentiation is not sufficient to induce IL-4 expression. Histograms show IL-4 production profiles of Stat6+/+ WT or CIITATg cells (CD45.1+), or Stat6−/− cells (CD45.2+) in the co-cultures. The percentage of positive cells in each gate is shown.
Figure 5.
Figure 5.
NKT cells are not responsible for the IL-4–producing potential of T-CD4 Th1 cells. (A) Age-matched WT, CIITATg, CD1d−/−, and CIITATg/CD1d−/−mice were injected with 10 μg anti-CD3 antibody and killed 2 h later. The circulating IL-4 level in the serum was determined by ELISA. The error bars represent the mean ± SD of IL-4 measurements in the indicated mice. (B) CD4 T cells from CIITATg mice that were sufficient or deficient in CD1d expression were examined for their cytokine production profile by ICS after Th1 or Th2 cell differentiation. WT or CIITATg littermates on the CD1d+/− background were used as controls. Data are representative of at least two independent experiments. The percentage of positive cells in each quadrant is shown.
Figure 6.
Figure 6.
T-CD4 T cells acquire the potential to express IL-4 in the thymus. (A) Histone H3 at the IL-4 locus is hyperacetylated in CIITATg CD4 T cells and thymocytes. Naive (CD44loCD45RBhi) CD4 T cells and CD4 SP thymocytes from WT and CIITATg mice were sorted and used for the ChIP assay with an antiacetylated histone H3 antibody. PCR primers specific for the IL-4 enhancer were used to amplify the precipitated DNA. No antibody was used as the negative control for the immunoprecipitation, and primers specific for CD3ε were used as an internal loading control. Note that the CD3ε mRNA level was equivalent between WT and CIITATg T cells (not depicted). (B) CIITATg CD4 SP thymocytes are poised to express the IL-4 gene. RNA was extracted from CD4 SP thymocytes from WT and CIITATg mice immediately after FACS sorting. IL-4 mRNA was quantified by quantitative RT-PCR, and the results were expressed as ratios relative to the housekeeping gene GAPDH. (C) CD4 SP T cells are capable of producing IL-4. Sorted NK1.1 CD4 SP cells from WT, CIITATg, or CIITATg/CIITA−/− thymocytes were stimulated with PMA plus ionomycin for 5 h. Cytokine production was analyzed by ICS. The percentage of positive cells in each quadrant is shown.
Figure 7.
Figure 7.
Allergen-induced airway inflammation is attenuated in CIITATg mice. Total BALF cells (A) and percentages of differential cell counts (B) in the BALF of WT and CIITATg mice 48 h after the last OVA aerosol treatment were determined. Each symbol in the graphs represents one mouse. Eos, eosinophils; Neu, neutrophils; LM, lymphocytes; MC, monocytes. (C) Reduced perivascular eosinophilic infiltration in CIITATg lung sections 2 d after the last exposure to OVA. Eosinophils are the red-staining cells in the H&E lung sections. Bars: (top) 100 μm; (bottom) 25 μm. (D) OVA-specific serum IgE levels. (E) Real-time RT-PCR of cytokine mRNA levels in the lung tissue of the OVA-challenged mice. The error bars represent the mean ± SD of six mice in each group. Horizontal lines in A and D represent median values. The Student's two-tailed t test was used to calculate statistical significance. Data are pooled from two independent experiments. P < 0.05 was considered statistically significant. *, P < 0.05; **, P < 0.01.

References

    1. Mosmann, T.R., H. Cherwinski, M.W. Bond, M.A. Giedlin, and R.L. Coffman. 1986. Two types of murine helper T cell clone. I. Definition according to profiles of lymphokine activities and secreted proteins. J. Immunol. 175:5–14. - PubMed
    1. Harrington, L.E., R.D. Hatton, P.R. Mangan, H. Turner, T.L. Murphy, K.M. Murphy, and C.T. Weaver. 2005. Interleukin 17-producing CD4+ effector T cells develop via a lineage distinct from the T helper type 1 and 2 lineages. Nat. Immunol. 6:1123–1132. - PubMed
    1. Park, H., Z. Li, X.O. Yang, S.H. Chang, R. Nurieva, Y.H. Wang, Y. Wang, L. Hood, Z. Zhu, Q. Tian, and C. Dong. 2005. A distinct lineage of CD4 T cells regulates tissue inflammation by producing interleukin 17. Nat. Immunol. 6:1133–1141. - PMC - PubMed
    1. Weaver, C.T., L.E. Harrington, P.R. Mangan, M. Gavrieli, and K.M. Murphy. 2006. Th17: an effector CD4 T cell lineage with regulatory T cell ties. Immunity. 24:677–688. - PubMed
    1. Langrish, C.L., Y. Chen, W.M. Blumenschein, J. Mattson, B. Basham, J.D. Sedgwick, T. McClanahan, R.A. Kastelein, and D.J. Cua. 2005. IL-23 drives a pathogenic T cell population that induces autoimmune inflammation. J. Exp. Med. 201:233–240. - PMC - PubMed

Publication types

MeSH terms